29
/fr/
fr
AIzaSyAYiBZKx7MnpbEhh9jyipgxe19OcubqV5w
April 1, 2024
186015
Madagascar
MDG
true
2
1
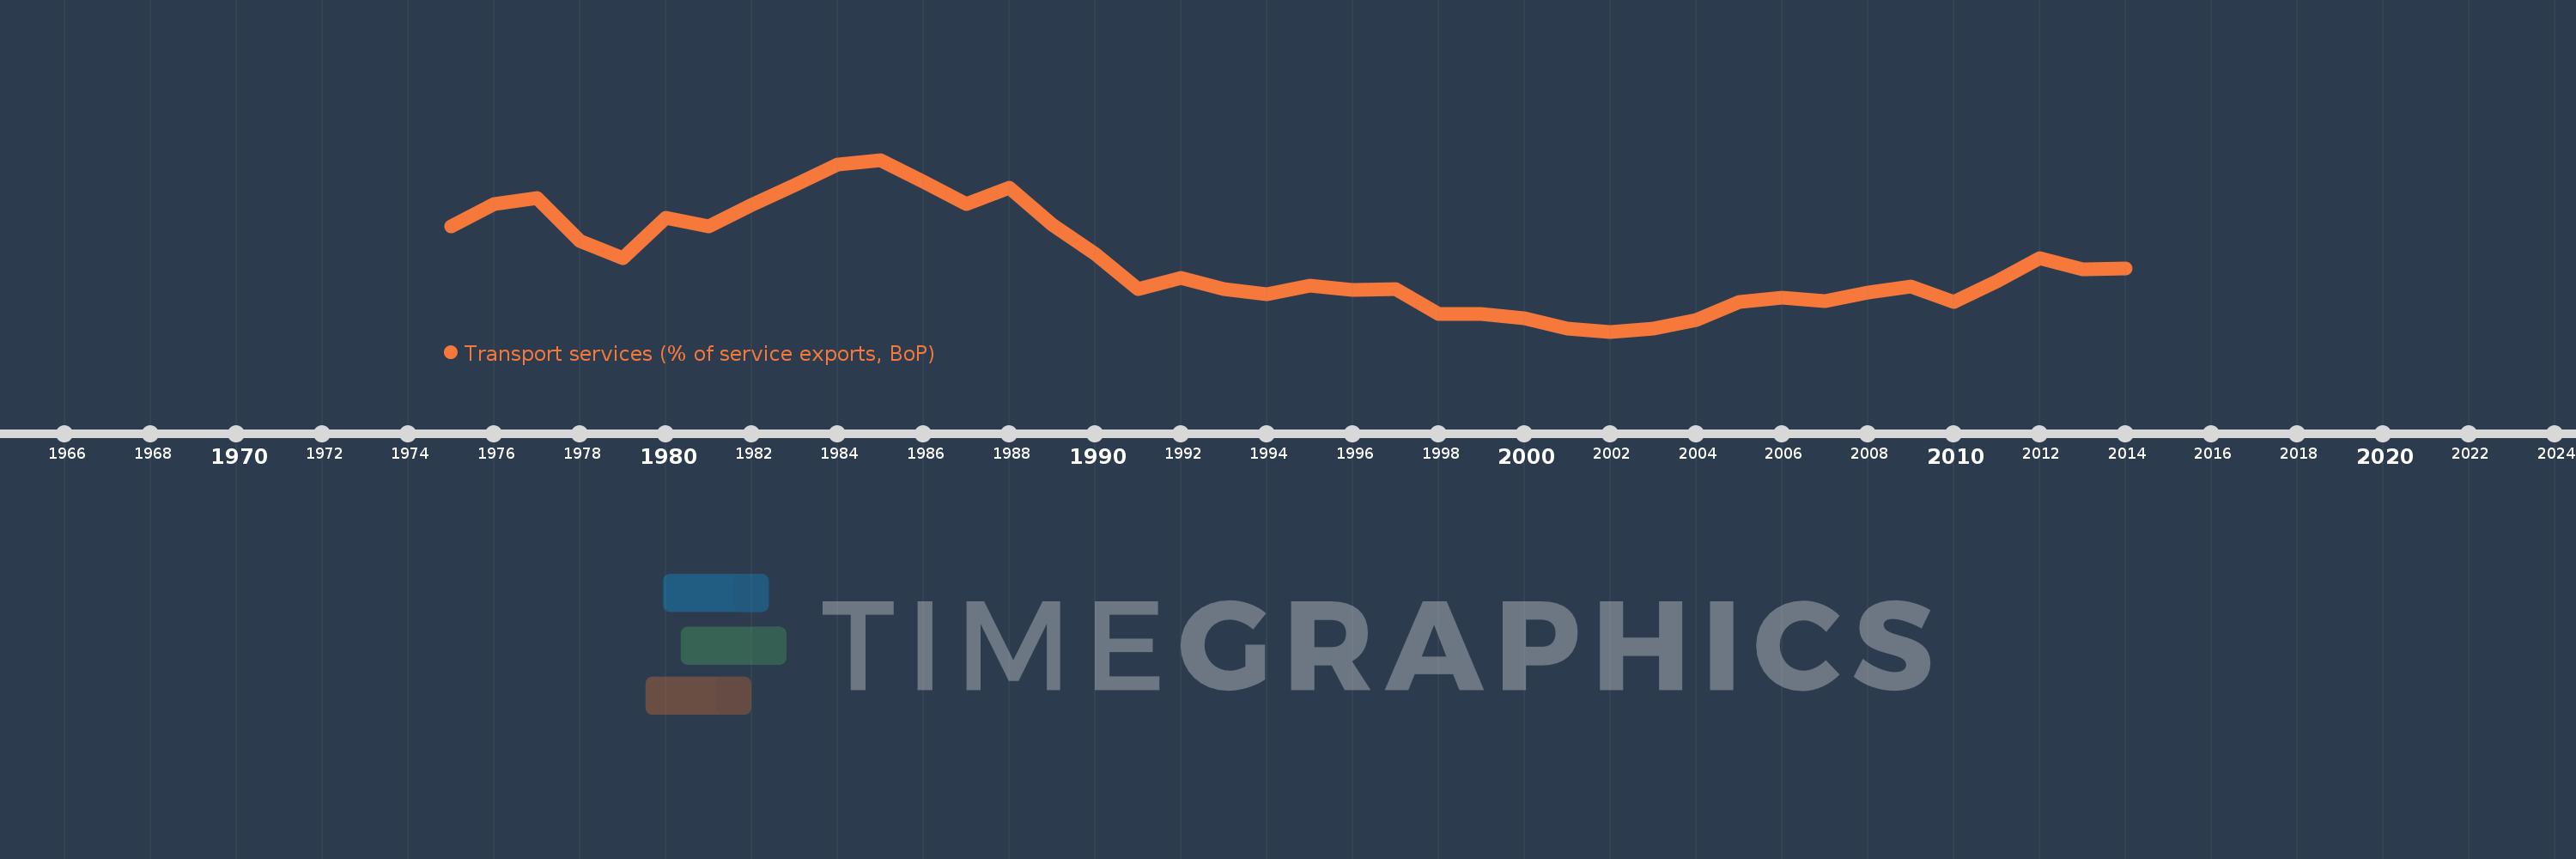
Transport services (% of service exports, BoP)
2014,2013,2012,2011,2010,2009,2008,2007,2006,2005,2004,2003,2002,2001,2000,1999,1998,1997,1996,1995,1994,1993,1992,1991,1990,1989,1988,1987,1986,1985,1984,1983,1982,1981,1980,1979,1978,1977,1976,1975
Cette statistique dans les autres pays:
AfghanistanAlbaniaAlgeriaAngolaAntigua and BarbudaArab WorldArgentinaArmeniaArubaAustraliaAustriaAzerbaijanBahamas, TheBahrainBangladeshBarbadosBelarusBelgiumBelizeBeninBermudaBhutanBoliviaBosnia and HerzegovinaBotswanaBrazilBrunei DarussalamBulgariaBurkina FasoBurundiCabo VerdeCambodiaCameroonCanadaCaribbean small statesCentral African RepublicCentral Europe and the BalticsChadChileChinaColombiaComorosCongo, Dem. Rep.Congo, Rep.Costa RicaCote d'IvoireCroatiaCuracaoCyprusCzech RepublicDenmarkDjiboutiDominicaDominican RepublicEarly-demographic dividendEast Asia & PacificEast Asia & Pacific (excluding high income)East Asia & Pacific (IDA & IBRD countries)EcuadorEgypt, Arab Rep.El SalvadorEritreaEstoniaEthiopiaEuro areaEurope & Central AsiaEurope & Central Asia (excluding high income)Europe & Central Asia (IDA & IBRD countries)European UnionFaroe IslandsFijiFinlandFragile and conflict affected situationsFranceFrench PolynesiaGabonGambia, TheGeorgiaGermanyGhanaGreeceGrenadaGuatemalaGuineaGuinea-BissauGuyanaHaitiHeavily indebted poor countries (HIPC)High incomeHondurasHong Kong SAR, ChinaHungaryIBRD onlyIcelandIDA & IBRD totalIDA onlyIDA totalIndiaIndonesiaIran, Islamic Rep.IraqIrelandIsraelItalyJamaicaJapanJordanKazakhstanKenyaKiribatiKorea, Rep.KosovoKuwaitKyrgyz RepublicLao PDRLate-demographic dividendLatin America & Caribbean Latin America & Caribbean (excluding high income)Latin America & the Caribbean (IDA & IBRD countries)LatviaLeast developed countries: UN classificationLebanonLesothoLiberiaLibyaLithuaniaLow & middle incomeLow incomeLower middle incomeLuxembourgMacao SAR, ChinaMacedonia, FYRMadagascarMalawiMalaysiaMaldivesMaliMaltaMarshall IslandsMauritaniaMauritiusMexicoMicronesia, Fed. Sts.Middle East & North AfricaMiddle East & North Africa (excluding high income)Middle East & North Africa (IDA & IBRD countries)Middle incomeMoldovaMongoliaMontenegroMoroccoMozambiqueMyanmarNamibiaNepalNetherlandsNew CaledoniaNew ZealandNicaraguaNigerNigeriaNorth AmericaNorwayOECD membersOmanOther small statesPacific island small statesPakistanPalauPanamaPapua New GuineaParaguayPeruPhilippinesPolandPortugalPost-demographic dividendPre-demographic dividendQatarRomaniaRussian FederationRwandaSamoaSao Tome and PrincipeSaudi ArabiaSenegalSerbiaSeychellesSierra LeoneSingaporeSint Maarten (Dutch part)Slovak RepublicSloveniaSmall statesSolomon IslandsSouth AfricaSouth AsiaSouth Asia (IDA & IBRD)South SudanSpainSri LankaSt. Kitts and NevisSt. LuciaSt. Vincent and the GrenadinesSub-Saharan Africa Sub-Saharan Africa (excluding high income)Sub-Saharan Africa (IDA & IBRD countries)SudanSurinameSwazilandSwedenSwitzerlandSyrian Arab RepublicTajikistanTanzaniaThailandTimor-LesteTogoTongaTrinidad and TobagoTunisiaTurkeyTuvaluUgandaUkraineUnited KingdomUnited StatesUpper middle incomeUruguayVanuatuVenezuela, RBWest Bank and GazaWorldYemen, Rep.ZambiaZimbabwe La ligne de temps
Cette échelle de temps montre un graphique de 1975 année à 2014 année Madagascar. Les données jusqu'à 1974 année ne sont pas présentés. Quantité d'observations actuelles selon dates: 40.
Source (désignation):
Les indicateurs du développement mondiale
Source (organisation):
International Monetary Fund, Balance of Payments Statistics Yearbook and data files.
Catégories:
Economy & Growth, Trade
Dernière mise à jour
23 avr. 2017
Les indicateurs de changement de valeurs selon les années
Minimum:
11.681
1 janv. 2002
Maximum:
73.357
1 janv. 1985
Pour la date d''observation
Valeur
Changement absolu
Le changement par rapport à la valeur précédente
1 janv. 1975
49.411
+49.411
0.0%
1 janv. 1976
57.472
+8.061
16.31%
1 janv. 1977
59.611
+2.14
3.72%
1 janv. 1978
44.262
-15.349
-25.75%
1 janv. 1979
38.119
-6.143
-13.88%
1 janv. 1980
52.665
+14.546
38.16%
1 janv. 1981
49.363
-3.303
-6.27%
1 janv. 1982
57.057
+7.695
15.59%
1 janv. 1983
64.157
+7.099
12.44%
1 janv. 1984
71.552
+7.395
11.53%
1 janv. 1985
73.357
+1.805
2.52%
1 janv. 1986
65.348
-8.009
-10.92%
1 janv. 1987
57.556
-7.792
-11.92%
1 janv. 1988
63.2
+5.644
9.81%
1 janv. 1989
50.147
-13.053
-20.65%
1 janv. 1990
39.654
-10.493
-20.93%
1 janv. 1991
27.088
-12.565
-31.69%
1 janv. 1992
31.089
+4.001
14.77%
1 janv. 1993
26.955
-4.134
-13.3%
1 janv. 1994
25.205
-1.75
-6.49%
1 janv. 1995
28.214
+3.008
11.94%
1 janv. 1996
26.725
-1.489
-5.28%
1 janv. 1997
27.079
+0.354
1.32%
1 janv. 1998
17.923
-9.155
-33.81%
1 janv. 1999
18.148
+0.225
1.25%
1 janv. 2000
16.469
-1.679
-9.25%
1 janv. 2001
12.619
-3.85
-23.38%
1 janv. 2002
11.681
-0.938
-7.43%
1 janv. 2003
12.773
+1.092
9.35%
1 janv. 2004
15.967
+3.194
25.0%
1 janv. 2005
22.2
+6.233
39.04%
1 janv. 2006
23.818
+1.618
7.29%
1 janv. 2007
22.762
-1.056
-4.43%
1 janv. 2008
25.593
+2.831
12.44%
1 janv. 2009
27.867
+2.274
8.89%
1 janv. 2010
22.346
-5.522
-19.81%
1 janv. 2011
29.764
+7.418
33.2%
1 janv. 2012
37.914
+8.15
27.38%
1 janv. 2013
33.944
-3.97
-10.47%
1 janv. 2014
34.281
+0.337
0.99%
Classement des pays selon les statistiques actuelles par années


Commentaires: