29
/fr/
fr
AIzaSyAYiBZKx7MnpbEhh9jyipgxe19OcubqV5w
April 1, 2024
182155
Luxembourg
LUX
true
2
1
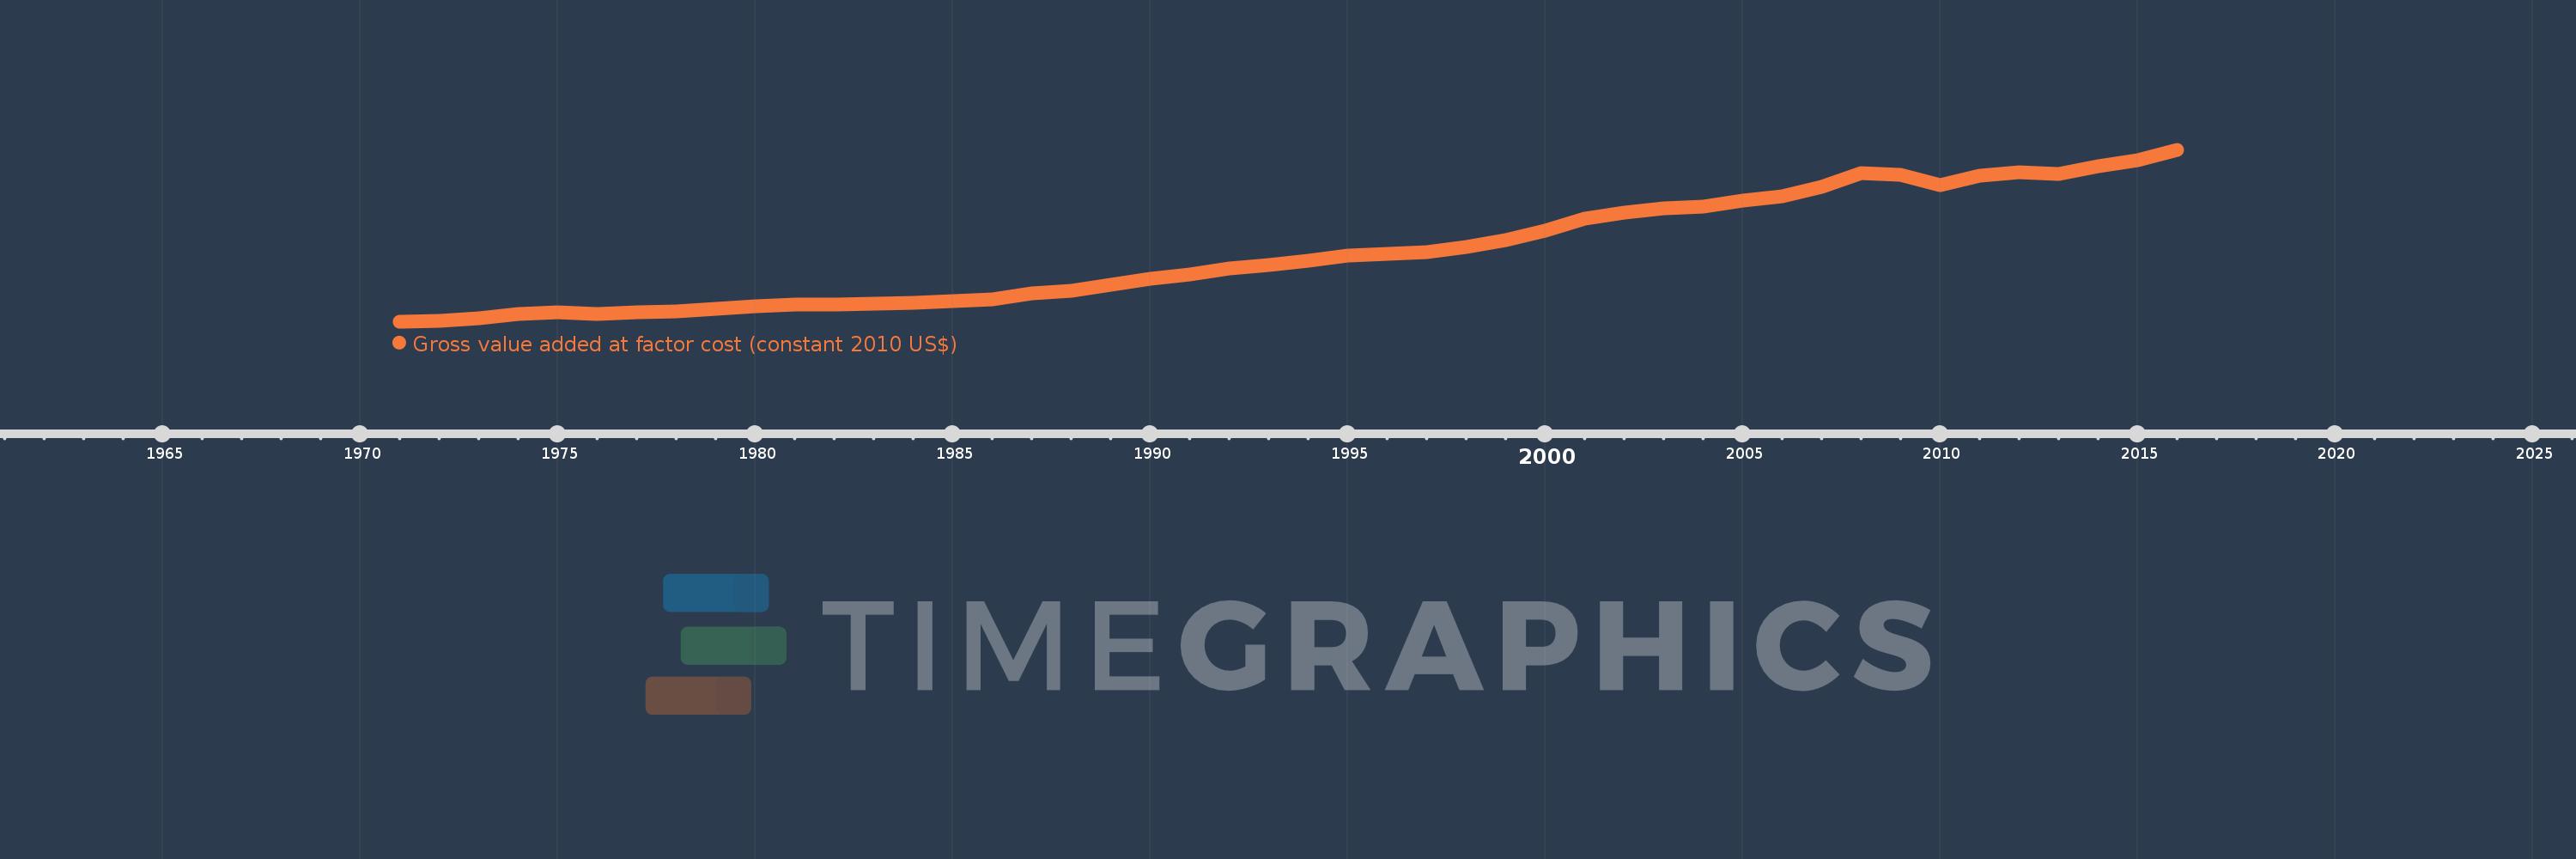
Gross value added at factor cost (constant 2010 US$)
2016,2015,2014,2013,2012,2011,2010,2009,2008,2007,2006,2005,2004,2003,2002,2001,2000,1999,1998,1997,1996,1995,1994,1993,1992,1991,1990,1989,1988,1987,1986,1985,1984,1983,1982,1981,1980,1979,1978,1977,1976,1975,1974,1973,1972,1971
Cette statistique dans les autres pays:
AfghanistanAlbaniaAlgeriaAndorraAntigua and BarbudaArgentinaArmeniaArubaAustraliaAustriaAzerbaijanBahamas, TheBangladeshBarbadosBelarusBelgiumBelizeBeninBermudaBhutanBoliviaBosnia and HerzegovinaBotswanaBrazilBulgariaBurkina FasoBurundiCabo VerdeCambodiaCameroonCanadaCaribbean small statesCentral African RepublicCentral Europe and the BalticsChadChileColombiaCongo, Dem. Rep.Costa RicaCroatiaCubaCyprusCzech RepublicDenmarkDominicaDominican RepublicEarly-demographic dividendEcuadorEgypt, Arab Rep.El SalvadorEquatorial GuineaEstoniaEthiopiaEuro areaEurope & Central AsiaEurope & Central Asia (excluding high income)Europe & Central Asia (IDA & IBRD countries)European UnionFaroe IslandsFijiFinlandFranceGabonGambia, TheGeorgiaGermanyGhanaGreeceGrenadaGuatemalaGuineaGuinea-BissauGuyanaHeavily indebted poor countries (HIPC)High incomeHondurasHong Kong SAR, ChinaHungaryIcelandIDA blendIDA onlyIDA totalIndiaIndonesiaIran, Islamic Rep.IrelandItalyJamaicaJapanJordanKazakhstanKenyaKiribatiKorea, Rep.KosovoKuwaitKyrgyz RepublicLao PDRLatin America & Caribbean Latin America & Caribbean (excluding high income)Latin America & the Caribbean (IDA & IBRD countries)LatviaLeast developed countries: UN classificationLebanonLesothoLiechtensteinLithuaniaLow incomeLower middle incomeLuxembourgMacao SAR, ChinaMacedonia, FYRMadagascarMalawiMaldivesMaliMaltaMarshall IslandsMauritaniaMauritiusMexicoMicronesia, Fed. Sts.Middle East & North Africa (excluding high income)Middle East & North Africa (IDA & IBRD countries)MoldovaMongoliaMontenegroMoroccoMozambiqueNamibiaNepalNetherlandsNew ZealandNicaraguaNigeriaNorth AmericaNorwayOECD membersPacific island small statesPakistanPalauPanamaParaguayPeruPolandPortugalPost-demographic dividendPre-demographic dividendRomaniaRussian FederationRwandaSao Tome and PrincipeSenegalSerbiaSeychellesSierra LeoneSingaporeSlovak RepublicSloveniaSouth AfricaSouth AsiaSouth Asia (IDA & IBRD)SpainSri LankaSt. Kitts and NevisSt. LuciaSt. Vincent and the GrenadinesSub-Saharan Africa Sub-Saharan Africa (excluding high income)Sub-Saharan Africa (IDA & IBRD countries)SudanSurinameSwazilandSwedenSwitzerlandTajikistanTanzaniaThailandTimor-LesteTongaTrinidad and TobagoTunisiaTurkeyTurkmenistanTuvaluUgandaUkraineUnited KingdomUnited StatesUruguayUzbekistanVanuatuVenezuela, RBVietnamWest Bank and GazaWorldZambiaZimbabwe La ligne de temps
Cette échelle de temps montre un graphique de 1971 année à 2016 année Luxembourg. Les données jusqu'à 1970 année ne sont pas présentés. Quantité d'observations actuelles selon dates: 46.
Source (désignation):
Les indicateurs du développement mondiale
Source (organisation):
World Bank national accounts data, and OECD National Accounts data files.
Catégories:
Economy & Growth
Dernière mise à jour
23 avr. 2017
Les indicateurs de changement de valeurs selon les années
Minimum:
8.329 mds
1 janv. 1971
Maximum:
53.954 mds
1 janv. 2016
Pour la date d''observation
Valeur
Changement absolu
Le changement par rapport à la valeur précédente
1 janv. 1971
8.329 mds
+8.329 mds
0.0%
1 janv. 1972
8.577 mds
+247.374 mln.
2.97%
1 janv. 1973
9.339 mds
+762.879 mln.
8.89%
1 janv. 1974
10.364 mds
+1.024 mds
10.97%
1 janv. 1975
10.97 mds
+605.798 mln.
5.85%
1 janv. 1976
10.525 mds
-444.321 mln.
-4.05%
1 janv. 1977
10.84 mds
+314.895 mln.
2.99%
1 janv. 1978
11.146 mds
+306.226 mln.
2.82%
1 janv. 1979
11.733 mds
+586.262 mln.
5.26%
1 janv. 1980
12.392 mds
+659.461 mln.
5.62%
1 janv. 1981
12.95 mds
+558.362 mln.
4.51%
1 janv. 1982
12.965 mds
+14.347 mln.
0.11%
1 janv. 1983
13.136 mds
+171.611 mln.
1.32%
1 janv. 1984
13.33 mds
+193.894 mln.
1.48%
1 janv. 1985
13.913 mds
+582.599 mln.
4.37%
1 janv. 1986
14.376 mds
+462.925 mln.
3.33%
1 janv. 1987
15.812 mds
+1.436 mds
9.99%
1 janv. 1988
16.61 mds
+798.102 mln.
5.05%
1 janv. 1989
18.157 mds
+1.547 mds
9.31%
1 janv. 1990
19.87 mds
+1.712 mds
9.43%
1 janv. 1991
21.0 mds
+1.131 mds
5.69%
1 janv. 1992
22.606 mds
+1.605 mds
7.64%
1 janv. 1993
23.46 mds
+853.907 mln.
3.78%
1 janv. 1994
24.653 mds
+1.194 mds
5.09%
1 janv. 1995
25.862 mds
+1.209 mds
4.9%
1 janv. 1996
26.529 mds
+666.703 mln.
2.58%
1 janv. 1997
26.96 mds
+430.799 mln.
1.62%
1 janv. 1998
28.311 mds
+1.351 mds
5.01%
1 janv. 1999
30.149 mds
+1.839 mds
6.49%
1 janv. 2000
32.663 mds
+2.513 mds
8.34%
1 janv. 2001
35.762 mds
+3.1 mds
9.49%
1 janv. 2002
37.29 mds
+1.527 mds
4.27%
1 janv. 2003
38.586 mds
+1.296 mds
3.48%
1 janv. 2004
39.007 mds
+421.325 mln.
1.09%
1 janv. 2005
40.609 mds
+1.602 mds
4.11%
1 janv. 2006
41.766 mds
+1.157 mds
2.85%
1 janv. 2007
44.116 mds
+2.35 mds
5.63%
1 janv. 2008
47.844 mds
+3.728 mds
8.45%
1 janv. 2009
47.302 mds
-542.384 mln.
-1.13%
1 janv. 2010
44.607 mds
-2.695 mds
-5.7%
1 janv. 2011
47.262 mds
+2.655 mds
5.95%
1 janv. 2012
48.199 mds
+936.954 mln.
1.98%
1 janv. 2013
47.627 mds
-572.318 mln.
-1.19%
1 janv. 2014
49.606 mds
+1.979 mds
4.16%
1 janv. 2015
51.388 mds
+1.781 mds
3.59%
1 janv. 2016
53.954 mds
+2.567 mds
4.99%
Classement des pays selon les statistiques actuelles par années


Commentaires: