29
/fr/
fr
AIzaSyAYiBZKx7MnpbEhh9jyipgxe19OcubqV5w
April 1, 2024
182020
Luxembourg
LUX
true
2
1
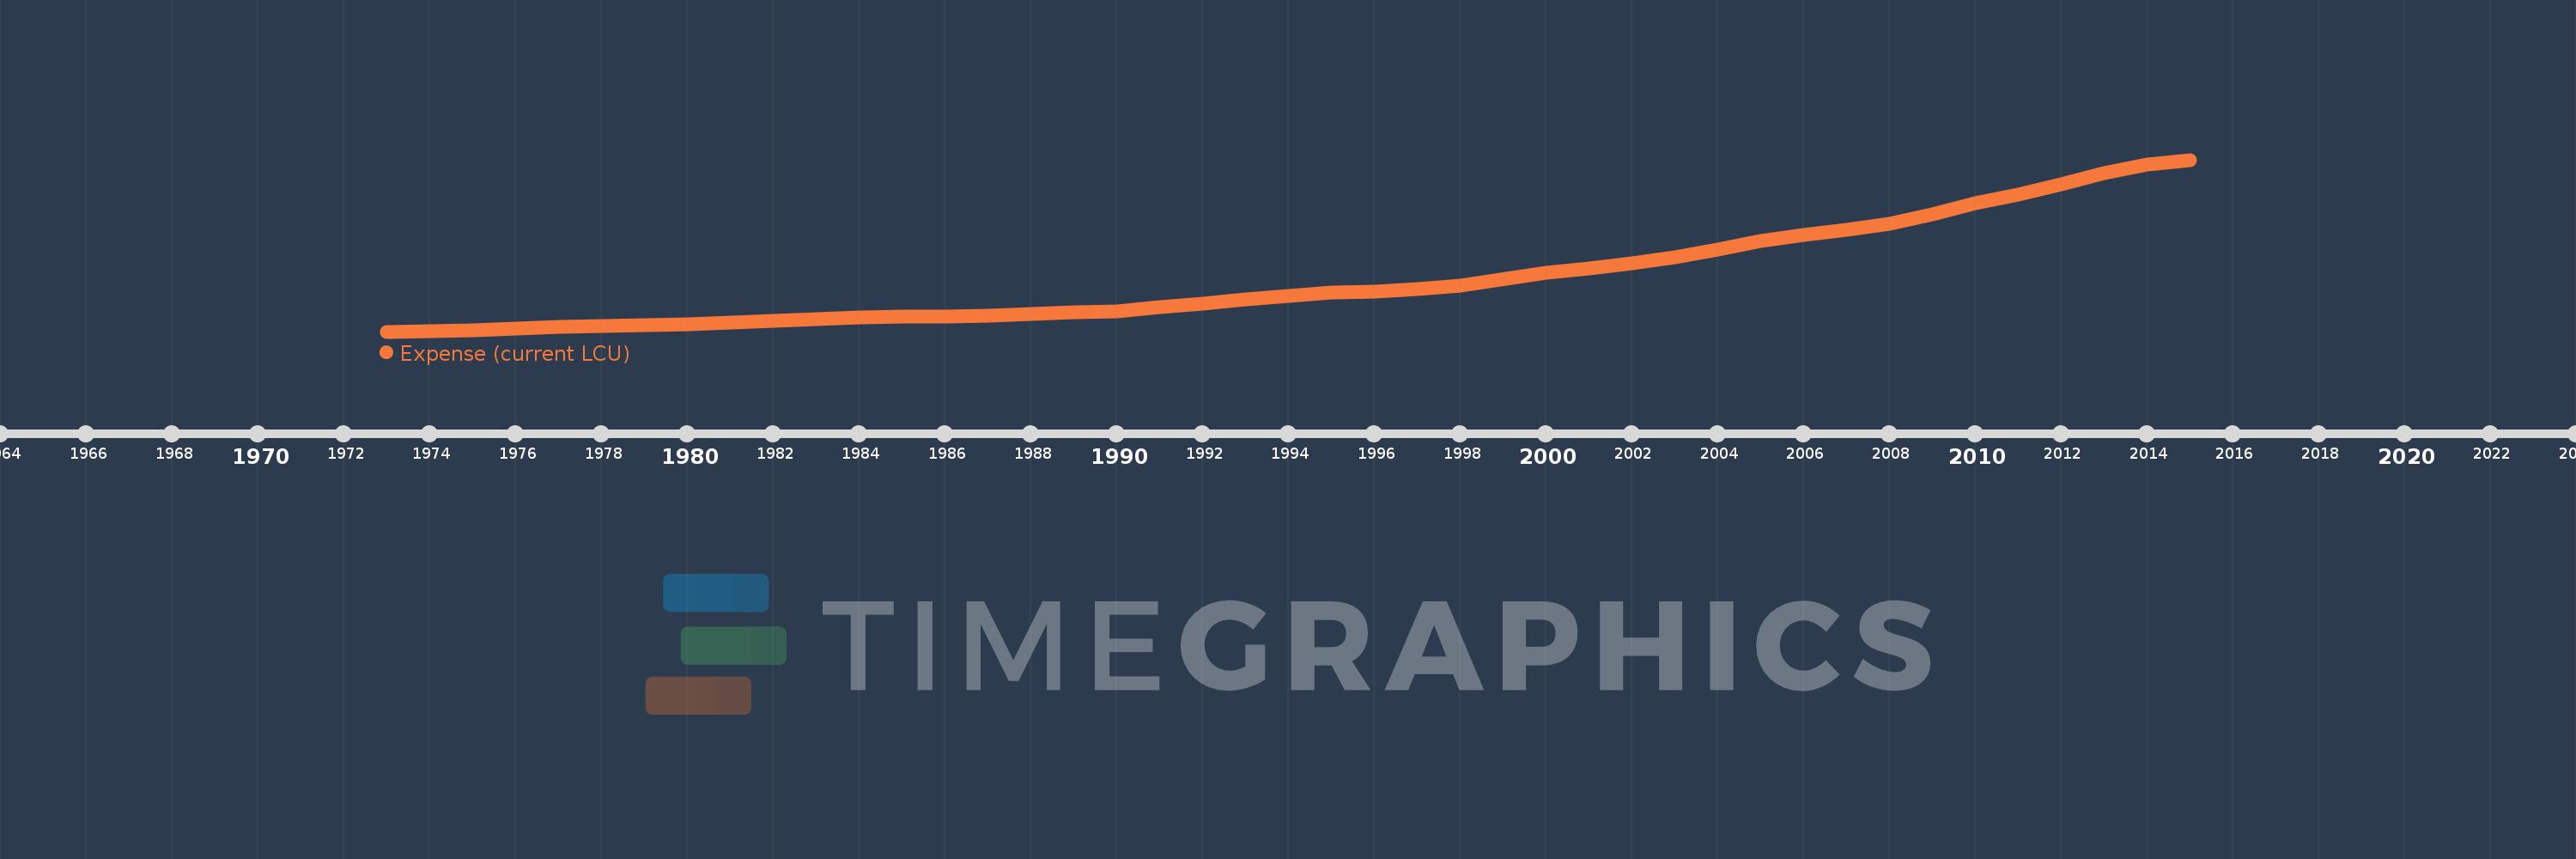
Expense (current LCU)
2015,2014,2013,2012,2011,2010,2009,2008,2007,2006,2005,2004,2003,2002,2001,2000,1998,1997,1996,1995,1994,1993,1992,1991,1990,1989,1988,1987,1986,1985,1984,1983,1982,1981,1980,1979,1978,1977,1976,1975,1974,1973
Cette statistique dans les autres pays:
AfghanistanAlbaniaAlgeriaAngolaAntigua and BarbudaArmeniaAustraliaAustriaAzerbaijanBahamas, TheBahrainBangladeshBarbadosBelarusBelgiumBelizeBeninBhutanBoliviaBosnia and HerzegovinaBotswanaBrazilBulgariaBurkina FasoBurundiCabo VerdeCambodiaCanadaCentral African RepublicChileColombiaCongo, Dem. Rep.Congo, Rep.Costa RicaCote d'IvoireCroatiaCyprusCzech RepublicDenmarkDominicaDominican RepublicEgypt, Arab Rep.El SalvadorEquatorial GuineaEstoniaEthiopiaFijiFinlandFranceGambia, TheGeorgiaGermanyGhanaGreeceGrenadaGuatemalaHondurasHong Kong SAR, ChinaHungaryIcelandIndiaIndonesiaIran, Islamic Rep.IraqIrelandIsraelItalyJamaicaJapanJordanKazakhstanKenyaKiribatiKorea, Rep.KuwaitKyrgyz RepublicLao PDRLatviaLebanonLesothoLiberiaLithuaniaLuxembourgMacao SAR, ChinaMacedonia, FYRMadagascarMalawiMalaysiaMaldivesMaliMaltaMauritiusMexicoMicronesia, Fed. Sts.MoldovaMongoliaMoroccoMozambiqueMyanmarNamibiaNepalNetherlandsNew ZealandNicaraguaNigeriaNorwayOmanPakistanPanamaPapua New GuineaParaguayPeruPhilippinesPolandPortugalQatarRomaniaRussian FederationRwandaSamoaSan MarinoSao Tome and PrincipeSenegalSerbiaSeychellesSierra LeoneSingaporeSlovak RepublicSloveniaSolomon IslandsSouth AfricaSpainSri LankaSt. Kitts and NevisSt. LuciaSurinameSwazilandSwedenSwitzerlandSyrian Arab RepublicTajikistanTanzaniaThailandTimor-LesteTogoTrinidad and TobagoTunisiaTurkeyUgandaUkraineUnited Arab EmiratesUnited KingdomUnited StatesUruguayVanuatuVenezuela, RBVietnamWest Bank and GazaYemen, Rep.ZambiaZimbabwe La ligne de temps
Cette échelle de temps montre un graphique de 1973 année à 2015 année Luxembourg. Les données jusqu'à 1972 année ne sont pas présentés. Quantité d'observations actuelles selon dates: 42.
Source (désignation):
Les indicateurs du développement mondiale
Source (organisation):
International Monetary Fund, Government Finance Statistics Yearbook and data files.
Catégories:
Public Sector
Dernière mise à jour
23 avr. 2017
Les indicateurs de changement de valeurs selon les années
Minimum:
477.393 mln.
1 janv. 1973
Maximum:
19.523 mds
1 janv. 2015
Pour la date d''observation
Valeur
Changement absolu
Le changement par rapport à la valeur précédente
1 janv. 1973
477.393 mln.
+477.393 mln.
0.0%
1 janv. 1974
555.43 mln.
+78.037 mln.
16.35%
1 janv. 1975
663.685 mln.
+108.255 mln.
19.49%
1 janv. 1976
847.201 mln.
+183.516 mln.
27.65%
1 janv. 1977
991.996 mln.
+144.795 mln.
17.09%
1 janv. 1978
1.112 mds
+119.683 mln.
12.06%
1 janv. 1979
1.174 mds
+61.949 mln.
5.57%
1 janv. 1980
1.314 mds
+140.159 mln.
11.94%
1 janv. 1981
1.454 mds
+140.531 mln.
10.7%
1 janv. 1982
1.633 mds
+178.979 mln.
12.31%
1 janv. 1983
1.861 mds
+227.591 mln.
13.93%
1 janv. 1984
2.037 mds
+176.475 mln.
9.48%
1 janv. 1985
2.132 mds
+94.323 mln.
4.63%
1 janv. 1986
2.158 mds
+26.425 mln.
1.24%
1 janv. 1987
2.278 mds
+119.683 mln.
5.55%
1 janv. 1988
2.466 mds
+188.647 mln.
8.28%
1 janv. 1989
2.648 mds
+181.979 mln.
7.38%
1 janv. 1990
2.753 mds
+104.19 mln.
3.93%
1 janv. 1991
3.195 mds
+442.118 mln.
16.06%
1 janv. 1992
3.54 mds
+345.142 mln.
10.8%
1 janv. 1993
4.065 mds
+524.667 mln.
14.82%
1 janv. 1994
4.415 mds
+350.819 mln.
8.63%
1 janv. 1995
4.77 mds
+354.24 mln.
8.02%
1 janv. 1996
4.886 mds
+116.807 mln.
2.45%
1 janv. 1997
5.153 mds
+266.163 mln.
5.45%
1 janv. 1998
5.586 mds
+433.838 mln.
8.42%
1 janv. 2000
6.964 mds
+1.378 mds
24.66%
1 janv. 2001
7.437 mds
+473.218 mln.
6.8%
1 janv. 2002
8.001 mds
+563.235 mln.
7.57%
1 janv. 2003
8.721 mds
+720.263 mln.
9.0%
1 janv. 2004
9.561 mds
+840.134 mln.
9.63%
1 janv. 2005
10.526 mds
+964.892 mln.
10.09%
1 janv. 2006
11.203 mds
+676.704 mln.
6.43%
1 janv. 2007
11.782 mds
+579.618 mln.
5.17%
1 janv. 2008
12.41 mds
+627.888 mln.
5.33%
1 janv. 2009
13.442 mds
+1.032 mds
8.32%
1 janv. 2010
14.716 mds
+1.274 mds
9.48%
1 janv. 2011
15.71 mds
+993.889 mln.
6.75%
1 janv. 2012
16.795 mds
+1.085 mds
6.91%
1 janv. 2013
18.086 mds
+1.29 mds
7.68%
1 janv. 2014
18.996 mds
+909.959 mln.
5.03%
1 janv. 2015
19.523 mds
+526.827 mln.
2.77%
Classement des pays selon les statistiques actuelles par années


Commentaires: