29
/fr/
fr
AIzaSyAYiBZKx7MnpbEhh9jyipgxe19OcubqV5w
April 1, 2024
178275
Lesotho
LSO
true
2
1
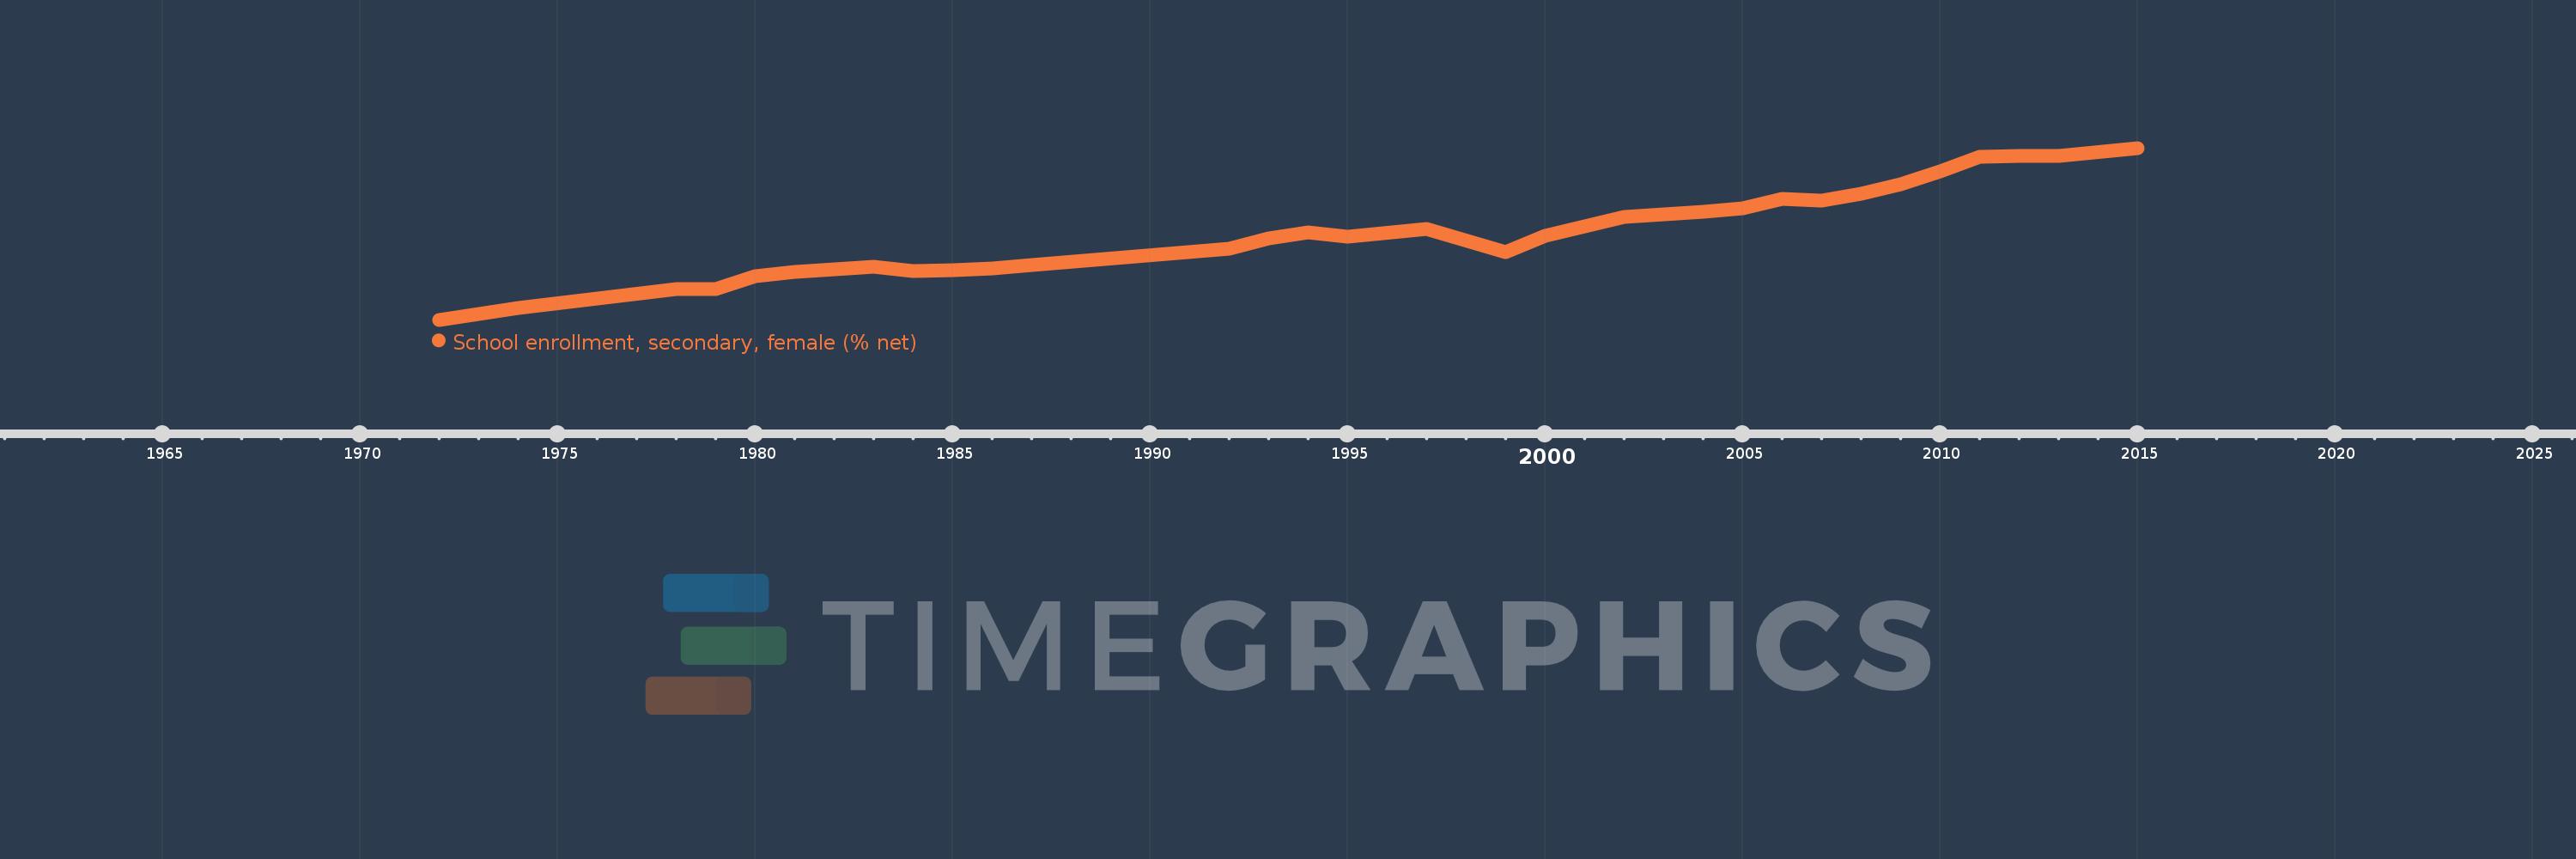
School enrollment, secondary, female (% net)
2015,2013,2012,2011,2010,2009,2008,2007,2006,2005,2004,2003,2002,2001,2000,1999,1997,1995,1994,1993,1992,1987,1986,1985,1984,1983,1982,1981,1980,1979,1978,1974,1972
Cette statistique dans les autres pays:
AfghanistanAlbaniaAlgeriaAngolaAntigua and BarbudaArab WorldArgentinaArmeniaArubaAustraliaAzerbaijanBahamas, TheBahrainBangladeshBarbadosBelarusBelgiumBelizeBeninBermudaBhutanBoliviaBotswanaBrazilBrunei DarussalamBulgariaBurkina FasoBurundiCabo VerdeCambodiaCameroonCanadaCaribbean small statesCentral African RepublicCentral Europe and the BalticsChadChileColombiaComorosCongo, Dem. Rep.Congo, Rep.Costa RicaCroatiaCubaCyprusDenmarkDjiboutiDominicaDominican RepublicEarly-demographic dividendEast Asia & PacificEast Asia & Pacific (excluding high income)East Asia & Pacific (IDA & IBRD countries)EcuadorEgypt, Arab Rep.El SalvadorEquatorial GuineaEritreaEstoniaEthiopiaEuro areaEurope & Central AsiaEurope & Central Asia (excluding high income)Europe & Central Asia (IDA & IBRD countries)European UnionFijiFinlandFragile and conflict affected situationsFranceGambia, TheGeorgiaGhanaGreeceGrenadaGuatemalaGuineaGuinea-BissauGuyanaHeavily indebted poor countries (HIPC)High incomeHondurasHong Kong SAR, ChinaHungaryIBRD onlyIcelandIDA & IBRD totalIDA blendIDA onlyIDA totalIndiaIndonesiaIran, Islamic Rep.IraqIrelandIsraelItalyJamaicaJapanJordanKazakhstanKenyaKiribatiKorea, Rep.KuwaitKyrgyz RepublicLao PDRLate-demographic dividendLatin America & Caribbean Latin America & Caribbean (excluding high income)Latin America & the Caribbean (IDA & IBRD countries)LatviaLeast developed countries: UN classificationLebanonLesothoLibyaLiechtensteinLithuaniaLow & middle incomeLow incomeLower middle incomeLuxembourgMacao SAR, ChinaMacedonia, FYRMadagascarMalawiMaldivesMaliMaltaMarshall IslandsMauritaniaMauritiusMexicoMiddle East & North AfricaMiddle East & North Africa (excluding high income)Middle East & North Africa (IDA & IBRD countries)Middle incomeMoldovaMongoliaMoroccoMozambiqueMyanmarNamibiaNauruNepalNetherlandsNew ZealandNicaraguaNigerNorth AmericaNorwayOECD membersOmanOther small statesPacific island small statesPakistanPanamaParaguayPeruPhilippinesPolandPortugalPost-demographic dividendPre-demographic dividendPuerto RicoQatarRomaniaSamoaSao Tome and PrincipeSaudi ArabiaSenegalSerbiaSeychellesSierra LeoneSloveniaSmall statesSolomon IslandsSomaliaSouth AfricaSouth AsiaSouth Asia (IDA & IBRD)SpainSri LankaSt. Kitts and NevisSt. LuciaSt. Vincent and the GrenadinesSub-Saharan Africa Sub-Saharan Africa (excluding high income)Sub-Saharan Africa (IDA & IBRD countries)SurinameSwazilandSwedenSwitzerlandSyrian Arab RepublicTajikistanThailandTimor-LesteTogoTongaTrinidad and TobagoTunisiaTurkeyTuvaluUgandaUkraineUnited Arab EmiratesUnited KingdomUnited StatesUpper middle incomeUruguayVanuatuVenezuela, RBWest Bank and GazaWorldYemen, Rep.Zimbabwe La ligne de temps
Cette échelle de temps montre un graphique de 1972 année à 2015 année Lesotho. Les données jusqu'à 1971 année ne sont pas présentés. Quantité d'observations actuelles selon dates: 33.
Source (désignation):
Les indicateurs du développement mondiale
Source (organisation):
United Nations Educational, Scientific, and Cultural Organization (UNESCO) Institute for Statistics.
Catégories:
Education, Gender
Dernière mise à jour
23 avr. 2017
Les indicateurs de changement de valeurs selon les années
Minimum:
5.493
1 janv. 1972
Maximum:
42.472
1 janv. 2015
Pour la date d''observation
Valeur
Changement absolu
Le changement par rapport à la valeur précédente
1 janv. 1972
5.493
+5.493
0.0%
1 janv. 1974
7.955
+2.462
44.82%
1 janv. 1978
12.137
+4.182
52.58%
1 janv. 1979
12.122
-0.015
-0.13%
1 janv. 1980
14.82
+2.698
22.26%
1 janv. 1981
15.792
+0.972
6.56%
1 janv. 1982
16.438
+0.647
4.09%
1 janv. 1983
16.909
+0.471
2.86%
1 janv. 1984
16.056
-0.854
-5.05%
1 janv. 1985
16.207
+0.151
0.94%
1 janv. 1986
16.588
+0.381
2.35%
1 janv. 1987
17.334
+0.746
4.5%
1 janv. 1992
20.716
+3.382
19.51%
1 janv. 1993
23.008
+2.292
11.06%
1 janv. 1994
24.255
+1.247
5.42%
1 janv. 1995
23.385
-0.87
-3.59%
1 janv. 1997
25.062
+1.677
7.17%
1 janv. 1999
20.064
-4.997
-19.94%
1 janv. 2000
23.595
+3.53
17.59%
1 janv. 2001
25.566
+1.972
8.36%
1 janv. 2002
27.656
+2.09
8.18%
1 janv. 2003
28.139
+0.483
1.75%
1 janv. 2004
28.695
+0.555
1.97%
1 janv. 2005
29.561
+0.867
3.02%
1 janv. 2006
31.419
+1.858
6.28%
1 janv. 2007
31.175
-0.243
-0.77%
1 janv. 2008
32.675
+1.499
4.81%
1 janv. 2009
34.645
+1.97
6.03%
1 janv. 2010
37.35
+2.706
7.81%
1 janv. 2011
40.55
+3.2
8.57%
1 janv. 2012
40.741
+0.191
0.47%
1 janv. 2013
40.816
+0.075
0.18%
1 janv. 2015
42.472
+1.656
4.06%
Classement des pays selon les statistiques actuelles par années


Commentaires: