29
/fr/
fr
AIzaSyAYiBZKx7MnpbEhh9jyipgxe19OcubqV5w
April 1, 2024
175652
Latvia
LVA
true
2
1
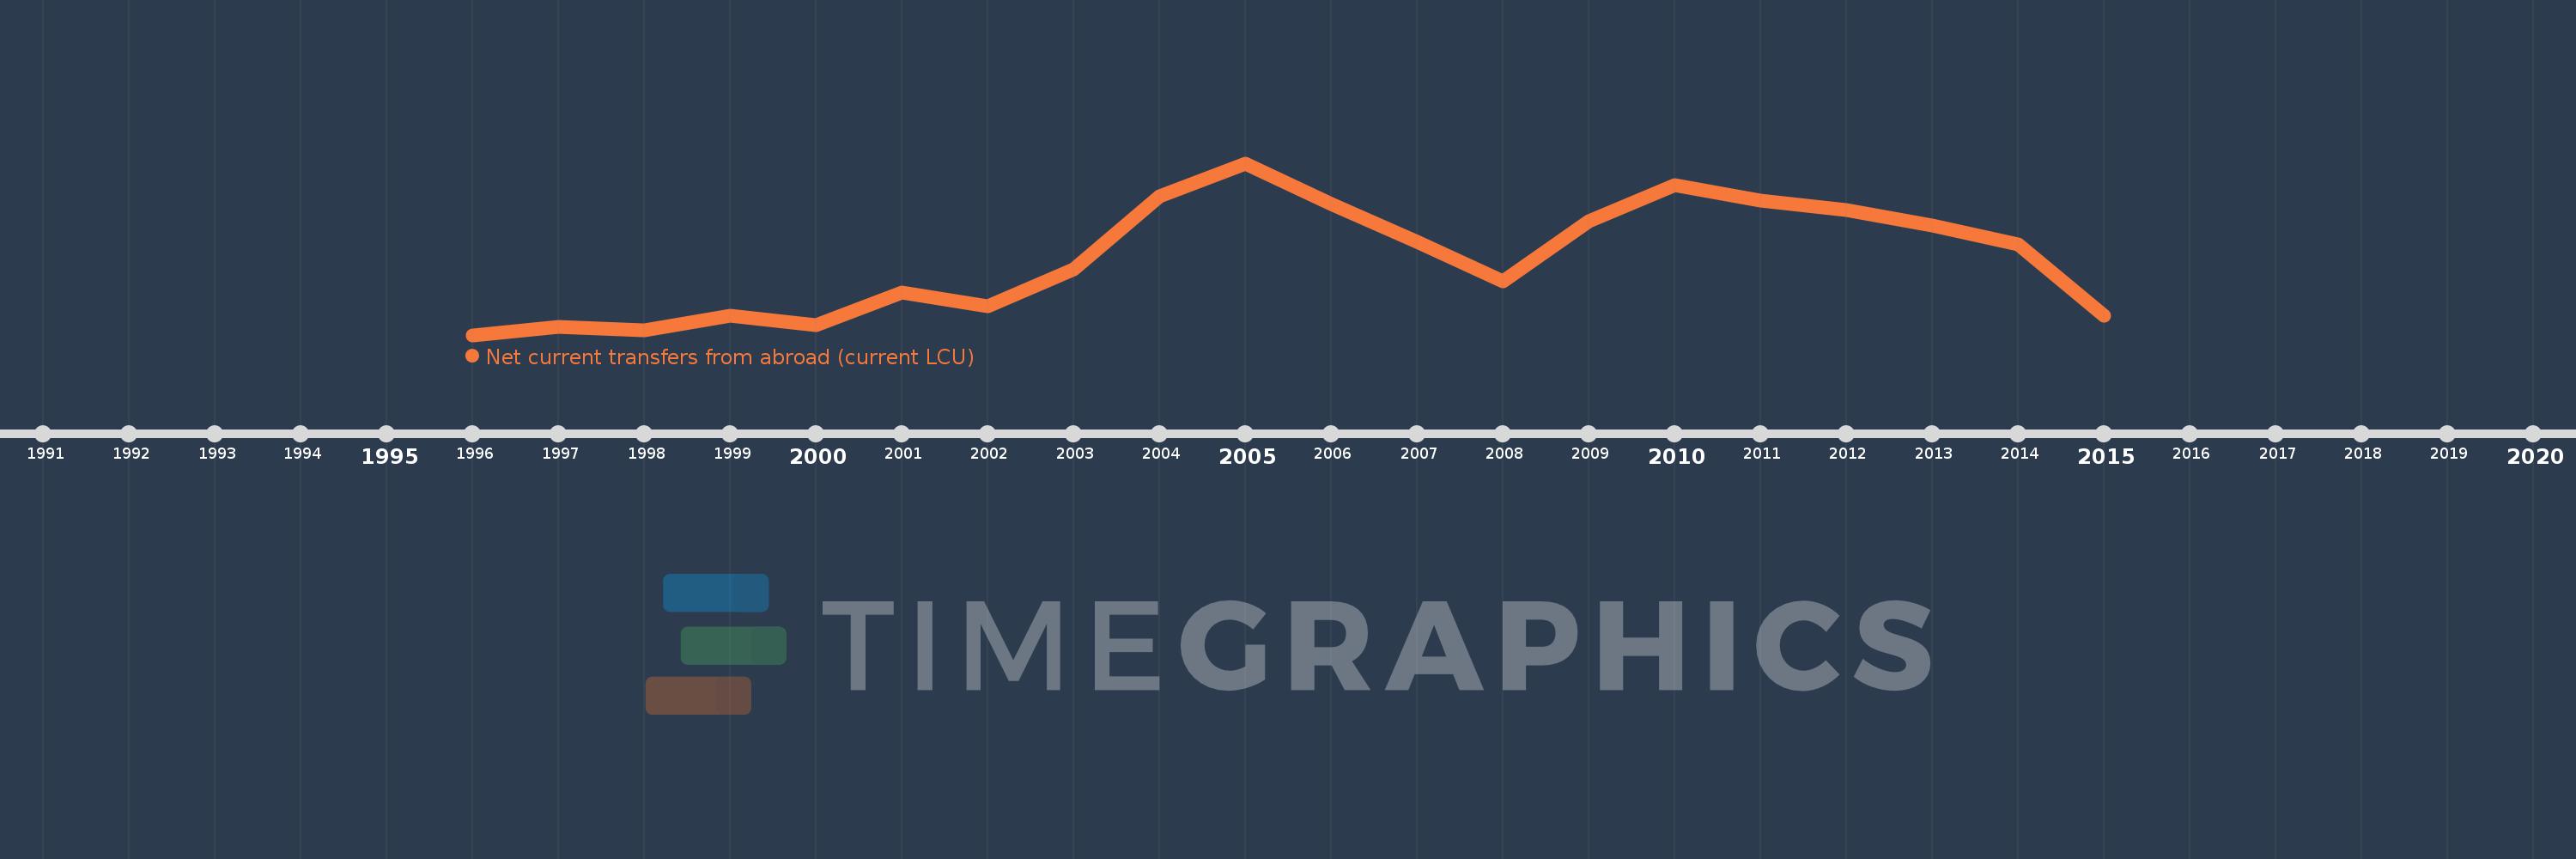
Net current transfers from abroad (current LCU)
2015,2014,2013,2012,2011,2010,2009,2008,2007,2006,2005,2004,2003,2002,2001,2000,1999,1998,1997,1996
Cette statistique dans les autres pays:
AfghanistanAlbaniaAlgeriaAngolaAntigua and BarbudaArgentinaArmeniaAustraliaAustriaAzerbaijanBahamas, TheBangladeshBarbadosBelarusBelgiumBelizeBeninBermudaBhutanBoliviaBosnia and HerzegovinaBotswanaBrazilBrunei DarussalamBulgariaBurkina FasoBurundiCabo VerdeCambodiaCameroonCanadaCentral African RepublicChadChileChinaColombiaComorosCongo, Dem. Rep.Congo, Rep.Costa RicaCote d'IvoireCroatiaCzech RepublicDenmarkDjiboutiDominicaDominican RepublicEcuadorEgypt, Arab Rep.El SalvadorEquatorial GuineaEritreaEstoniaEthiopiaFaroe IslandsFijiFinlandFranceFrench PolynesiaGabonGambia, TheGeorgiaGermanyGhanaGreeceGrenadaGuatemalaGuineaGuinea-BissauGuyanaHaitiHondurasHong Kong SAR, ChinaHungaryIcelandIndiaIndonesiaIran, Islamic Rep.IraqIrelandIsraelItalyJamaicaJapanJordanKazakhstanKenyaKiribatiKorea, Rep.KosovoKyrgyz RepublicLao PDRLatviaLebanonLesothoLiberiaLibyaLithuaniaMacedonia, FYRMadagascarMalawiMalaysiaMaldivesMaliMauritaniaMauritiusMexicoMoldovaMongoliaMontenegroMoroccoMozambiqueMyanmarNamibiaNepalNetherlandsNew ZealandNicaraguaNigerNigeriaNorwayPakistanPalauPanamaPapua New GuineaParaguayPeruPhilippinesPolandPortugalRomaniaRussian FederationRwandaSamoaSao Tome and PrincipeSenegalSerbiaSeychellesSierra LeoneSingaporeSlovak RepublicSloveniaSolomon IslandsSouth AfricaSouth SudanSpainSri LankaSt. Kitts and NevisSt. LuciaSt. Vincent and the GrenadinesSudanSurinameSwazilandSwedenSwitzerlandSyrian Arab RepublicTajikistanTanzaniaThailandTimor-LesteTogoTongaTrinidad and TobagoTunisiaTurkeyTurkmenistanUgandaUkraineUnited KingdomUnited StatesUruguayUzbekistanVanuatuVenezuela, RBVietnamWest Bank and GazaYemen, Rep.ZambiaZimbabwe La ligne de temps
Cette échelle de temps montre un graphique de 1996 année à 2015 année Latvia. Les données jusqu'à 1995 année ne sont pas présentés. Quantité d'observations actuelles selon dates: 20.
Source (désignation):
Les indicateurs du développement mondiale
Source (organisation):
World Bank national accounts data, and OECD National Accounts data files.
Catégories:
Economy & Growth
Dernière mise à jour
23 avr. 2017
Les indicateurs de changement de valeurs selon les années
Minimum:
50.945 mln.
1 janv. 1996
Maximum:
520.999 mln.
1 janv. 2005
Pour la date d''observation
Valeur
Changement absolu
Le changement par rapport à la valeur précédente
1 janv. 1996
50.945 mln.
+50.945 mln.
0.0%
1 janv. 1997
73.386 mln.
+22.441 mln.
44.05%
1 janv. 1998
63.993 mln.
-9.393 mln.
-12.8%
1 janv. 1999
104.106 mln.
+40.113 mln.
62.68%
1 janv. 2000
77.285 mln.
-26.821 mln.
-25.76%
1 janv. 2001
168.344 mln.
+91.059 mln.
117.82%
1 janv. 2002
129.072 mln.
-39.272 mln.
-23.33%
1 janv. 2003
230.449 mln.
+101.377 mln.
78.54%
1 janv. 2004
430.008 mln.
+199.559 mln.
86.6%
1 janv. 2005
520.999 mln.
+90.991 mln.
21.16%
1 janv. 2006
409.113 mln.
-111.886 mln.
-21.48%
1 janv. 2007
305.697 mln.
-103.416 mln.
-25.28%
1 janv. 2008
197.087 mln.
-108.61 mln.
-35.53%
1 janv. 2009
363.187 mln.
+166.1 mln.
84.28%
1 janv. 2010
460.404 mln.
+97.217 mln.
26.77%
1 janv. 2011
419.721 mln.
-40.683 mln.
-8.84%
1 janv. 2012
392.052 mln.
-27.669 mln.
-6.59%
1 janv. 2013
350.126 mln.
-41.926 mln.
-10.69%
1 janv. 2014
299.021 mln.
-51.105 mln.
-14.6%
1 janv. 2015
103.077 mln.
-195.944 mln.
-65.53%
Classement des pays selon les statistiques actuelles par années


Commentaires: