29
/fr/
fr
AIzaSyAYiBZKx7MnpbEhh9jyipgxe19OcubqV5w
April 1, 2024
171678
Kuwait
KWT
true
2
1
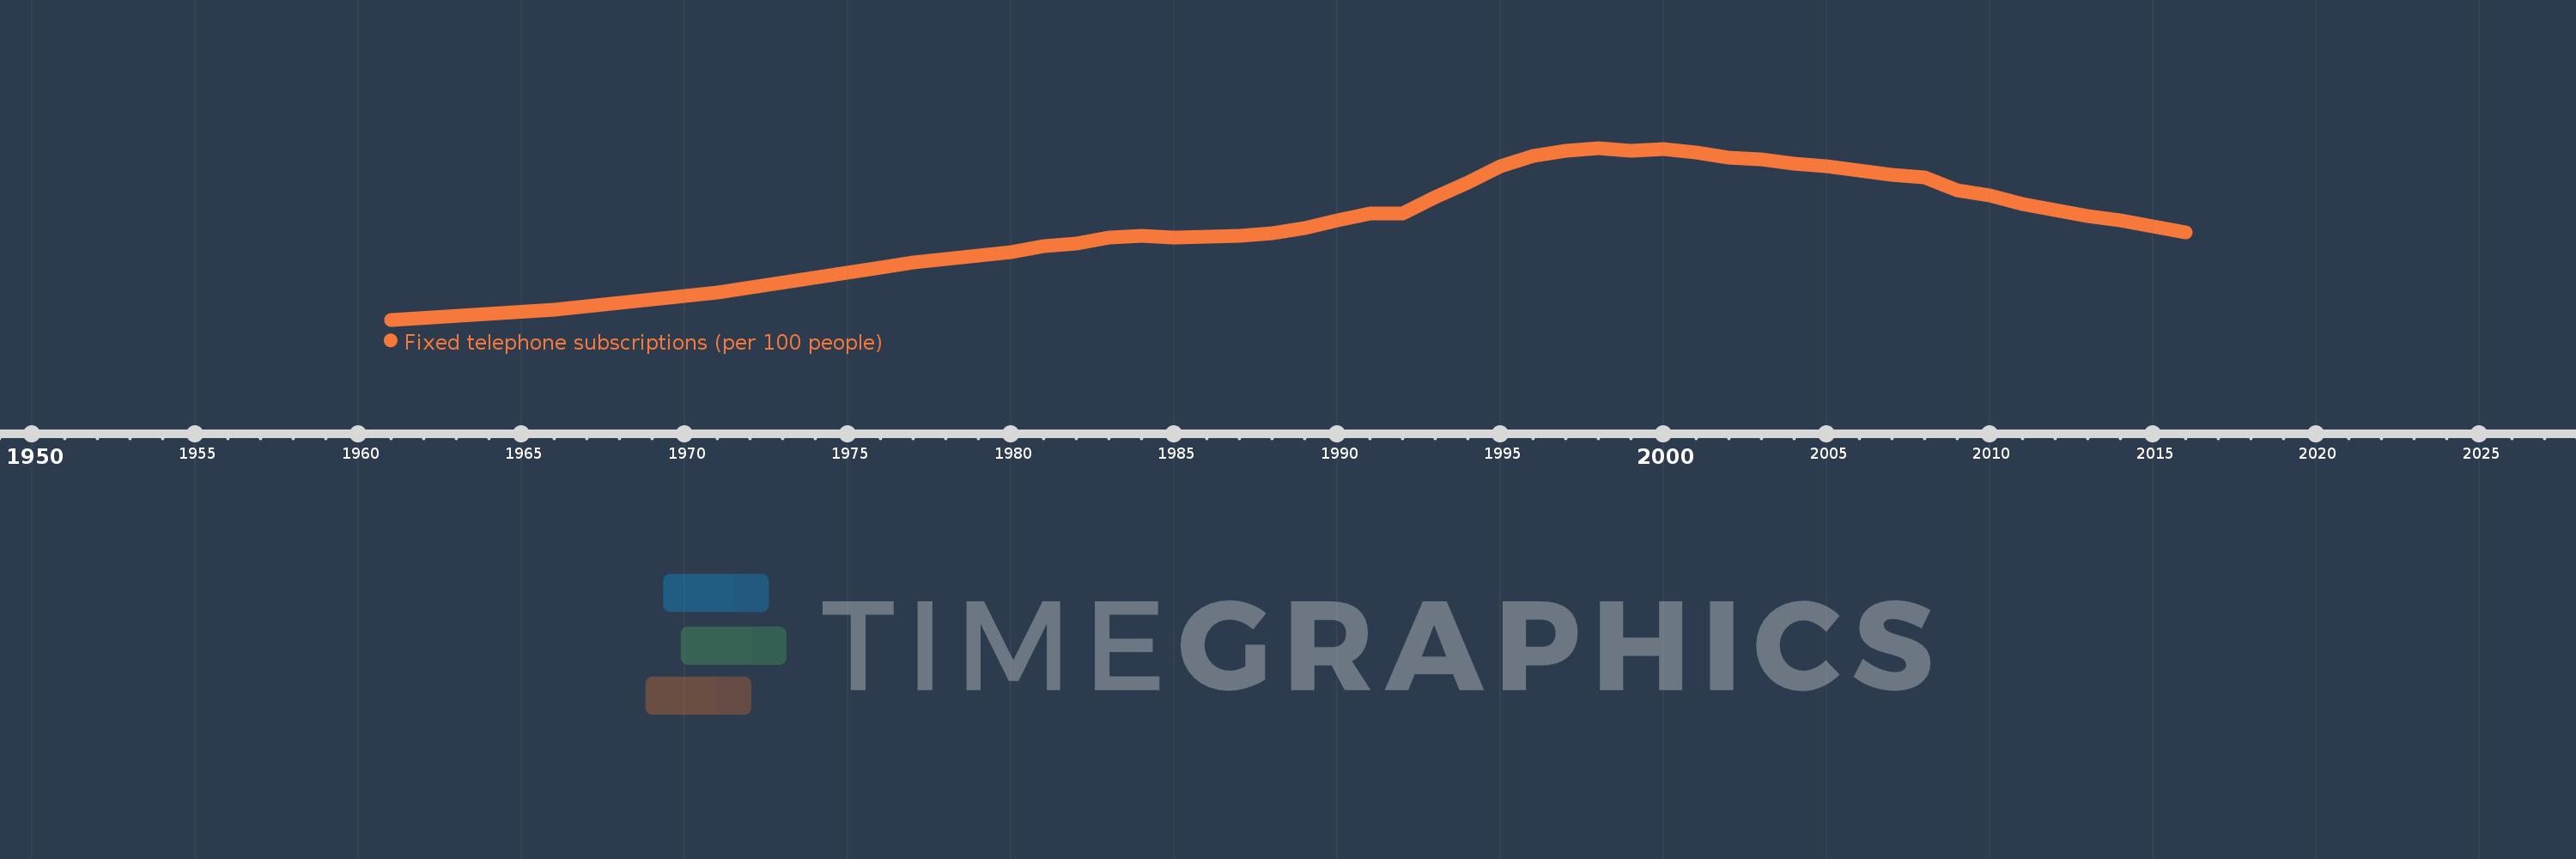
Fixed telephone subscriptions (per 100 people)
2016,2015,2014,2013,2012,2011,2010,2009,2008,2007,2006,2005,2004,2003,2002,2001,2000,1999,1998,1997,1996,1995,1994,1993,1992,1991,1990,1989,1988,1987,1986,1985,1984,1983,1982,1981,1980,1979,1978,1977,1976,1971,1966,1961
Cette statistique dans les autres pays:
AfghanistanAlbaniaAlgeriaAmerican SamoaAndorraAngolaAntigua and BarbudaArab WorldArgentinaArmeniaArubaAustraliaAustriaAzerbaijanBahamas, TheBahrainBangladeshBarbadosBelarusBelgiumBelizeBeninBermudaBhutanBoliviaBosnia and HerzegovinaBotswanaBrazilBritish Virgin IslandsBrunei DarussalamBulgariaBurkina FasoBurundiCabo VerdeCambodiaCameroonCanadaCaribbean small statesCayman IslandsCentral African RepublicCentral Europe and the BalticsChadChileChinaColombiaComorosCongo, Dem. Rep.Congo, Rep.Costa RicaCote d'IvoireCroatiaCubaCuracaoCyprusCzech RepublicDenmarkDjiboutiDominicaDominican RepublicEarly-demographic dividendEast Asia & PacificEast Asia & Pacific (excluding high income)East Asia & Pacific (IDA & IBRD countries)EcuadorEgypt, Arab Rep.El SalvadorEquatorial GuineaEritreaEstoniaEthiopiaEuro areaEurope & Central AsiaEurope & Central Asia (excluding high income)Europe & Central Asia (IDA & IBRD countries)European UnionFaroe IslandsFijiFinlandFragile and conflict affected situationsFranceFrench PolynesiaGabonGambia, TheGeorgiaGermanyGhanaGibraltarGreeceGreenlandGrenadaGuamGuatemalaGuineaGuinea-BissauGuyanaHaitiHeavily indebted poor countries (HIPC)High incomeHondurasHong Kong SAR, ChinaHungaryIBRD onlyIcelandIDA & IBRD totalIDA blendIDA onlyIDA totalIndiaIndonesiaIran, Islamic Rep.IraqIrelandIsraelItalyJamaicaJapanJordanKazakhstanKenyaKiribatiKorea, Dem. People’s Rep.Korea, Rep.KosovoKuwaitKyrgyz RepublicLao PDRLate-demographic dividendLatin America & Caribbean Latin America & Caribbean (excluding high income)Latin America & the Caribbean (IDA & IBRD countries)LatviaLeast developed countries: UN classificationLebanonLesothoLiberiaLibyaLiechtensteinLithuaniaLow & middle incomeLow incomeLower middle incomeLuxembourgMacao SAR, ChinaMacedonia, FYRMadagascarMalawiMalaysiaMaldivesMaliMaltaMarshall IslandsMauritaniaMauritiusMexicoMicronesia, Fed. Sts.Middle East & North AfricaMiddle East & North Africa (excluding high income)Middle East & North Africa (IDA & IBRD countries)Middle incomeMoldovaMonacoMongoliaMontenegroMoroccoMozambiqueMyanmarNamibiaNauruNepalNetherlandsNew CaledoniaNew ZealandNicaraguaNigerNigeriaNorth AmericaNorthern Mariana IslandsNorwayOECD membersOmanOther small statesPacific island small statesPakistanPalauPanamaPapua New GuineaParaguayPeruPhilippinesPolandPortugalPost-demographic dividendPre-demographic dividendPuerto RicoQatarRomaniaRussian FederationRwandaSamoaSan MarinoSao Tome and PrincipeSaudi ArabiaSenegalSerbiaSeychellesSierra LeoneSingaporeSlovak RepublicSloveniaSmall statesSolomon IslandsSomaliaSouth AfricaSouth AsiaSouth Asia (IDA & IBRD)South SudanSpainSri LankaSt. Kitts and NevisSt. LuciaSt. Vincent and the GrenadinesSub-Saharan Africa Sub-Saharan Africa (excluding high income)Sub-Saharan Africa (IDA & IBRD countries)SudanSurinameSwazilandSwedenSwitzerlandSyrian Arab RepublicTajikistanTanzaniaThailandTimor-LesteTogoTongaTrinidad and TobagoTunisiaTurkeyTurkmenistanTurks and Caicos IslandsTuvaluUgandaUkraineUnited Arab EmiratesUnited KingdomUnited StatesUpper middle incomeUruguayUzbekistanVanuatuVenezuela, RBVietnamVirgin Islands (U.S.)West Bank and GazaWorldYemen, Rep.ZambiaZimbabwe La ligne de temps
Cette échelle de temps montre un graphique de 1961 année à 2016 année Kuwait. Les données jusqu'à 1960 année ne sont pas présentés. Quantité d'observations actuelles selon dates: 44.
Source (désignation):
Les indicateurs du développement mondiale
Source (organisation):
International Telecommunication Union, World Telecommunication/ICT Development Report and database.
Catégories:
Infrastructure
Dernière mise à jour
23 avr. 2017
Les indicateurs de changement de valeurs selon les années
Minimum:
1.266
1 janv. 1961
Maximum:
25.161
1 janv. 1998
Pour la date d''observation
Valeur
Changement absolu
Le changement par rapport à la valeur précédente
1 janv. 1961
1.266
+1.266
0.0%
1 janv. 1966
2.696
+1.43
112.99%
1 janv. 1971
5.064
+2.368
87.85%
1 janv. 1976
8.476
+3.412
67.39%
1 janv. 1977
9.262
+0.785
9.27%
1 janv. 1978
9.704
+0.443
4.78%
1 janv. 1979
10.175
+0.47
4.85%
1 janv. 1980
10.661
+0.486
4.78%
1 janv. 1981
11.447
+0.786
7.37%
1 janv. 1982
11.824
+0.377
3.29%
1 janv. 1983
12.714
+0.89
7.53%
1 janv. 1984
12.94
+0.226
1.78%
1 janv. 1985
12.738
-0.202
-1.56%
1 janv. 1986
12.822
+0.084
0.66%
1 janv. 1987
12.926
+0.103
0.81%
1 janv. 1988
13.272
+0.347
2.68%
1 janv. 1989
14.037
+0.764
5.76%
1 janv. 1990
15.095
+1.058
7.54%
1 janv. 1991
16.089
+0.995
6.59%
1 janv. 1992
16.098
+0.009
0.05%
1 janv. 1993
18.289
+2.191
13.61%
1 janv. 1994
20.357
+2.068
11.31%
1 janv. 1995
22.621
+2.263
11.12%
1 janv. 1996
24.102
+1.481
6.55%
1 janv. 1997
24.718
+0.616
2.56%
1 janv. 1998
25.161
+0.443
1.79%
1 janv. 1999
24.81
-0.35
-1.39%
1 janv. 2000
25.057
+0.247
0.99%
1 janv. 2001
24.502
-0.555
-2.22%
1 janv. 2002
23.852
-0.65
-2.65%
1 janv. 2003
23.527
-0.325
-1.36%
1 janv. 2004
23.007
-0.52
-2.21%
1 janv. 2005
22.626
-0.381
-1.65%
1 janv. 2006
21.983
-0.643
-2.84%
1 janv. 2007
21.385
-0.598
-2.72%
1 janv. 2008
21.066
-0.319
-1.49%
1 janv. 2009
19.242
-1.824
-8.66%
1 janv. 2010
18.543
-0.699
-3.63%
1 janv. 2011
17.363
-1.18
-6.37%
1 janv. 2012
16.472
-0.891
-5.13%
1 janv. 2013
15.69
-0.782
-4.75%
1 janv. 2014
15.081
-0.609
-3.88%
1 janv. 2015
14.198
-0.883
-5.85%
1 janv. 2016
13.395
-0.803
-5.65%
Classement des pays selon les statistiques actuelles par années


Commentaires: