29
/fr/
fr
AIzaSyAYiBZKx7MnpbEhh9jyipgxe19OcubqV5w
April 1, 2024
170609
Korea, Rep.
KOR
true
2
1
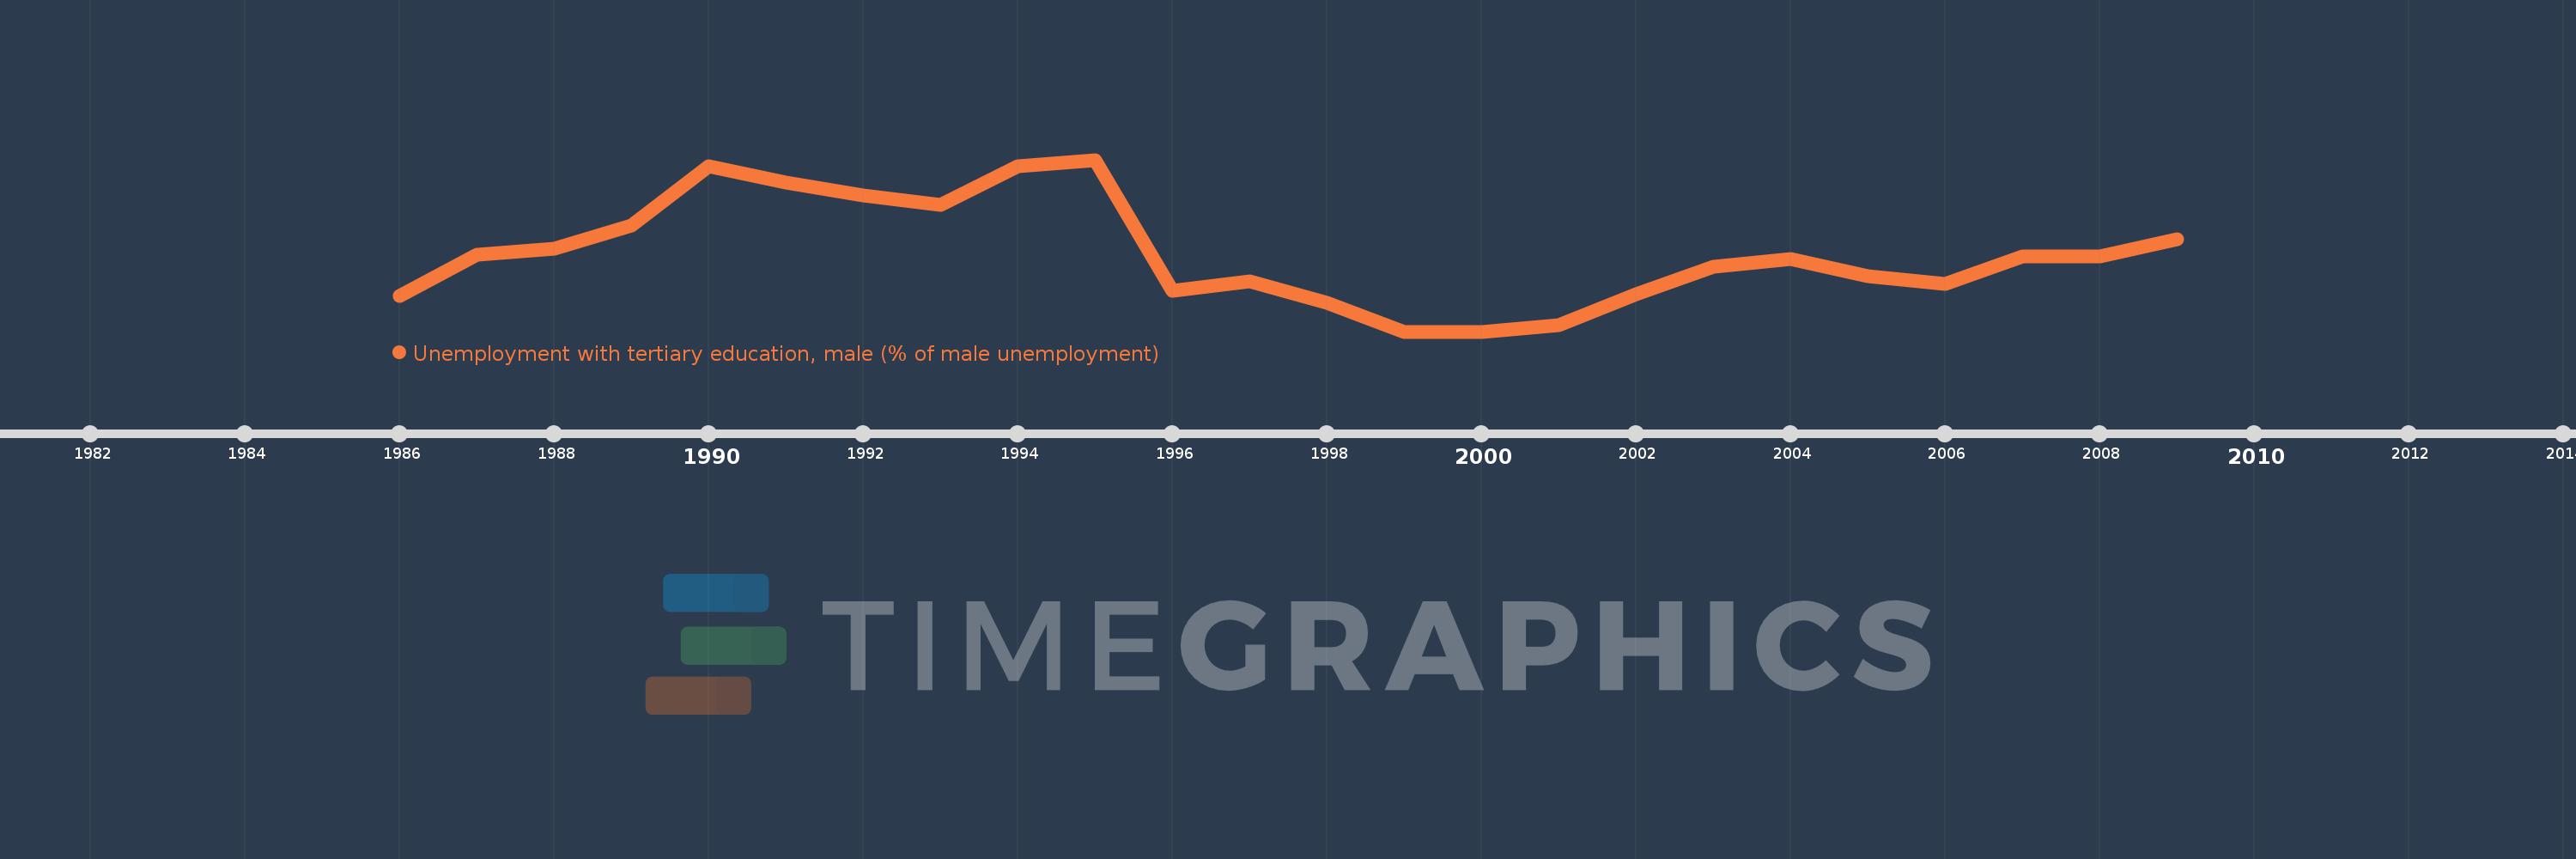
Unemployment with tertiary education, male (% of male unemployment)
2009,2008,2007,2006,2005,2004,2003,2002,2001,2000,1999,1998,1997,1996,1995,1994,1993,1992,1991,1990,1989,1988,1987,1986
Cette statistique dans les autres pays:
La ligne de temps
Cette échelle de temps montre un graphique de 1986 année à 2009 année Korea, Rep.. Les données jusqu'à 1985 année ne sont pas présentés. Quantité d'observations actuelles selon dates: 24.
Source (désignation):
Les indicateurs du développement mondiale
Source (organisation):
International Labour Organization, Key Indicators of the Labour Market database.
Catégories:
Social Protection & Labor, Gender
Dernière mise à jour
23 avr. 2017
Les indicateurs de changement de valeurs selon les années
Pour la date d''observation
Valeur
Changement absolu
Le changement par rapport à la valeur précédente
1 janv. 1986
16.3
+16.3
0.0%
1 janv. 1987
19.4
+3.1
19.02%
1 janv. 1988
19.9
+0.5
2.58%
1 janv. 1989
21.6
+1.7
8.54%
1 janv. 1990
26.1
+4.5
20.83%
1 janv. 1991
24.9
-1.2
-4.6%
1 janv. 1992
23.9
-1.0
-4.02%
1 janv. 1993
23.2
-0.7
-2.93%
1 janv. 1994
26.1
+2.9
12.5%
1 janv. 1995
26.6
+0.5
1.92%
1 janv. 1996
16.7
-9.9
-37.22%
1 janv. 1997
17.4
+0.7
4.19%
1 janv. 1998
15.8
-1.6
-9.2%
1 janv. 1999
13.6
-2.2
-13.92%
1 janv. 2000
13.6
0.0
0.0%
1 janv. 2001
14.1
+0.5
3.68%
1 janv. 2002
16.4
+2.3
16.31%
1 janv. 2003
18.5
+2.1
12.8%
1 janv. 2004
19.1
+0.6
3.24%
1 janv. 2005
17.8
-1.3
-6.81%
1 janv. 2006
17.2
-0.6
-3.37%
1 janv. 2007
19.3
+2.1
12.21%
1 janv. 2008
19.3
0.0
0.0%
1 janv. 2009
20.6
+1.3
6.74%
Classement des pays selon les statistiques actuelles par années


Commentaires: