29
/fr/
fr
AIzaSyAYiBZKx7MnpbEhh9jyipgxe19OcubqV5w
April 1, 2024
170127
Korea, Rep.
KOR
true
2
1
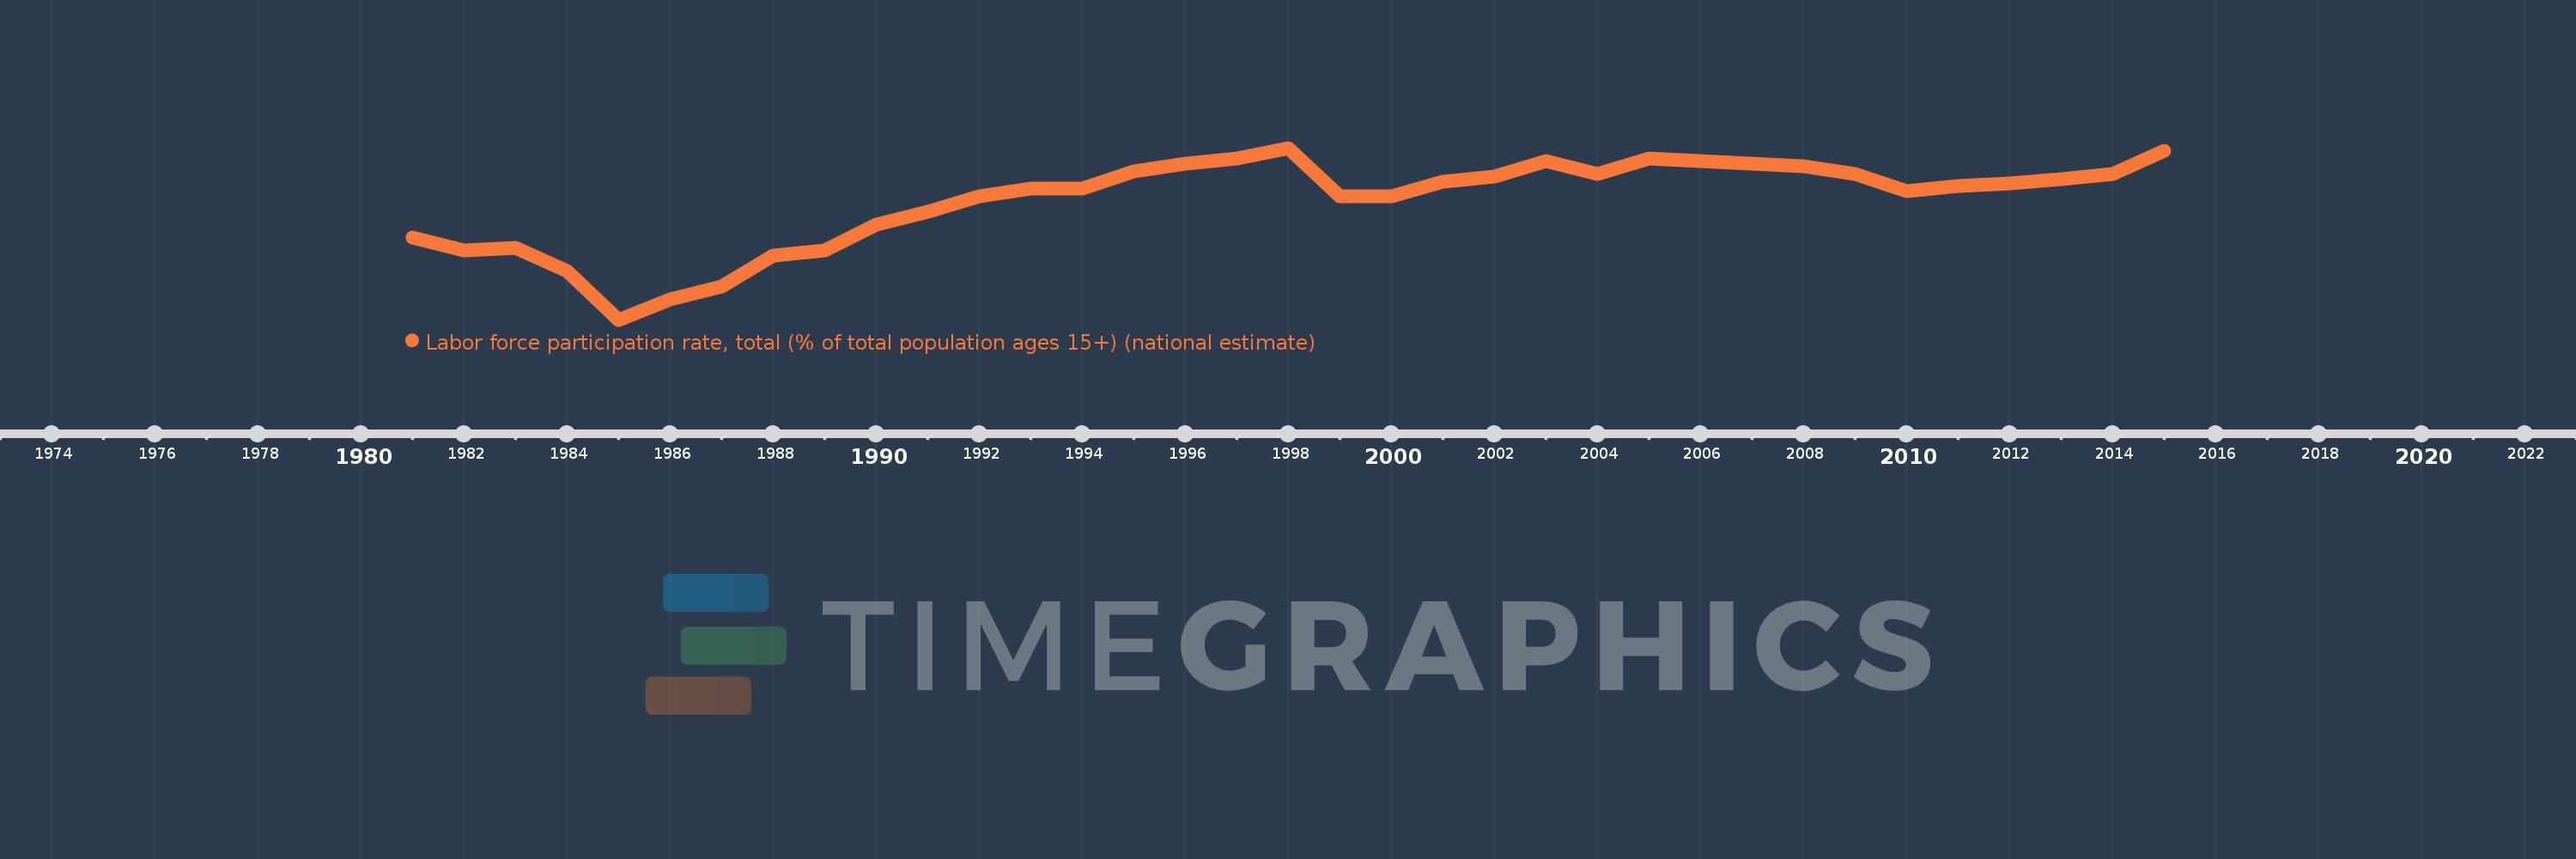
Labor force participation rate, total (% of total population ages 15+) (national estimate)
2015,2014,2013,2012,2011,2010,2009,2008,2007,2006,2005,2004,2003,2002,2001,2000,1999,1998,1997,1996,1995,1994,1993,1992,1991,1990,1989,1988,1987,1986,1985,1984,1983,1982,1981
Cette statistique dans les autres pays:
AfghanistanAlbaniaAlgeriaAmerican SamoaAntigua and BarbudaArab WorldArgentinaArmeniaArubaAustraliaAustriaAzerbaijanBahamas, TheBahrainBangladeshBarbadosBelarusBelgiumBelizeBeninBermudaBhutanBoliviaBosnia and HerzegovinaBotswanaBrazilBritish Virgin IslandsBrunei DarussalamBulgariaBurkina FasoBurundiCabo VerdeCambodiaCameroonCanadaCaribbean small statesCayman IslandsCentral African RepublicCentral Europe and the BalticsChadChileChinaColombiaComorosCongo, Dem. Rep.Congo, Rep.Costa RicaCote d'IvoireCroatiaCubaCyprusCzech RepublicDenmarkDjiboutiDominicaDominican RepublicEarly-demographic dividendEast Asia & PacificEast Asia & Pacific (excluding high income)East Asia & Pacific (IDA & IBRD countries)EcuadorEgypt, Arab Rep.El SalvadorEquatorial GuineaEstoniaEthiopiaEuro areaEurope & Central AsiaEurope & Central Asia (excluding high income)Europe & Central Asia (IDA & IBRD countries)European UnionFaroe IslandsFijiFinlandFranceFrench PolynesiaGabonGambia, TheGeorgiaGermanyGhanaGibraltarGreeceGrenadaGuamGuatemalaGuineaGuyanaHaitiHigh incomeHondurasHong Kong SAR, ChinaHungaryIBRD onlyIcelandIDA & IBRD totalIDA blendIndiaIndonesiaIran, Islamic Rep.IraqIrelandIsle of ManIsraelItalyJamaicaJapanJordanKazakhstanKenyaKiribatiKorea, Rep.KosovoKuwaitKyrgyz RepublicLao PDRLate-demographic dividendLatin America & Caribbean Latin America & Caribbean (excluding high income)Latin America & the Caribbean (IDA & IBRD countries)LatviaLebanonLesothoLiberiaLibyaLiechtensteinLithuaniaLow & middle incomeLower middle incomeLuxembourgMacao SAR, ChinaMacedonia, FYRMadagascarMalawiMalaysiaMaldivesMaliMaltaMarshall IslandsMauritaniaMauritiusMexicoMiddle East & North AfricaMiddle East & North Africa (excluding high income)Middle East & North Africa (IDA & IBRD countries)Middle incomeMoldovaMonacoMongoliaMontenegroMoroccoMozambiqueMyanmarNamibiaNauruNepalNetherlandsNew CaledoniaNew ZealandNicaraguaNigerNigeriaNorth AmericaNorthern Mariana IslandsNorwayOECD membersOmanPacific island small statesPakistanPalauPanamaPapua New GuineaParaguayPeruPhilippinesPolandPortugalPost-demographic dividendPuerto RicoQatarRomaniaRussian FederationRwandaSamoaSan MarinoSao Tome and PrincipeSaudi ArabiaSenegalSerbiaSeychellesSierra LeoneSingaporeSlovak RepublicSloveniaSolomon IslandsSouth AfricaSouth AsiaSouth Asia (IDA & IBRD)South SudanSpainSri LankaSt. Kitts and NevisSt. LuciaSt. Vincent and the GrenadinesSudanSurinameSwazilandSwedenSwitzerlandSyrian Arab RepublicTajikistanTanzaniaThailandTimor-LesteTogoTongaTrinidad and TobagoTunisiaTurkeyTurkmenistanTurks and Caicos IslandsTuvaluUgandaUkraineUnited Arab EmiratesUnited KingdomUnited StatesUpper middle incomeUruguayVanuatuVenezuela, RBVietnamVirgin Islands (U.S.)West Bank and GazaWorldYemen, Rep.ZambiaZimbabwe La ligne de temps
Cette échelle de temps montre un graphique de 1981 année à 2015 année Korea, Rep.. Les données jusqu'à 1980 année ne sont pas présentés. Quantité d'observations actuelles selon dates: 35.
Source (désignation):
Les indicateurs du développement mondiale
Source (organisation):
International Labour Organization, Key Indicators of the Labour Market database.
Catégories:
Social Protection & Labor
Dernière mise à jour
23 avr. 2017
Les indicateurs de changement de valeurs selon les années
Pour la date d''observation
Valeur
Changement absolu
Le changement par rapport à la valeur précédente
1 janv. 1981
59.0
+59.0
0.0%
1 janv. 1982
58.5
-0.5
-0.85%
1 janv. 1983
58.6
+0.1
0.17%
1 janv. 1984
57.7
-0.9
-1.54%
1 janv. 1985
55.8
-1.9
-3.29%
1 janv. 1986
56.6
+0.8
1.43%
1 janv. 1987
57.1
+0.5
0.88%
1 janv. 1988
58.3
+1.2
2.1%
1 janv. 1989
58.5
+0.2
0.34%
1 janv. 1990
59.5
+1.0
1.71%
1 janv. 1991
60.0
+0.5
0.84%
1 janv. 1992
60.6
+0.6
1.0%
1 janv. 1993
60.9
+0.3
0.5%
1 janv. 1994
60.9
0.0
0.0%
1 janv. 1995
61.6
+0.7
1.15%
1 janv. 1996
61.9
+0.3
0.49%
1 janv. 1997
62.1
+0.2
0.32%
1 janv. 1998
62.5
+0.4
0.64%
1 janv. 1999
60.6
-1.9
-3.04%
1 janv. 2000
60.6
0.0
0.0%
1 janv. 2001
61.2
+0.6
0.99%
1 janv. 2002
61.4
+0.2
0.33%
1 janv. 2003
62.0
+0.6
0.98%
1 janv. 2004
61.5
-0.5
-0.81%
1 janv. 2005
62.1
+0.6
0.98%
1 janv. 2006
62.0
-0.1
-0.16%
1 janv. 2007
61.9
-0.1
-0.16%
1 janv. 2008
61.8
-0.1
-0.16%
1 janv. 2009
61.5
-0.3
-0.49%
1 janv. 2010
60.8
-0.7
-1.14%
1 janv. 2011
61.0
+0.2
0.33%
1 janv. 2012
61.1
+0.1
0.16%
1 janv. 2013
61.3
+0.2
0.33%
1 janv. 2014
61.5
+0.2
0.33%
1 janv. 2015
62.4
+0.9
1.46%
Classement des pays selon les statistiques actuelles par années


Commentaires: