30
/fr/
AIzaSyAYiBZKx7MnpbEhh9jyipgxe19OcubqV5w
April 1, 2024
166816
Kazakhstan
KAZ
true
2
1
Researchers in R&D (per million people)
2014,2013,2012,2011,2010,2009,2008
Download
Bibliothèque de statistiques globales →Kazakhstan →

Researchers in R&D (per million people)

Cette statistique dans les autres pays:

AlbaniaAlgeriaAmerican SamoaAngolaArgentinaAustraliaAustriaBahrainBelgiumBoliviaBosnia and HerzegovinaBotswanaBrazilBrunei DarussalamBulgariaBurkina FasoCabo VerdeCambodiaCanadaCentral Europe and the BalticsChileChinaColombiaCongo, Rep.Costa RicaCote d'IvoireCroatiaCyprusCzech RepublicDenmarkEarly-demographic dividendEast Asia & PacificEast Asia & Pacific (excluding high income)East Asia & Pacific (IDA & IBRD countries)EcuadorEgypt, Arab Rep.EstoniaEthiopiaEuro areaEurope & Central AsiaEurope & Central Asia (excluding high income)Europe & Central Asia (IDA & IBRD countries)European UnionFaroe IslandsFinlandFranceGambia, TheGeorgiaGermanyGhanaGreeceGreenlandGuamGuatemalaHigh incomeHong Kong SAR, ChinaHungaryIBRD onlyIcelandIDA & IBRD totalIndiaIndonesiaIran, Islamic Rep.IraqIrelandIsraelItalyJapanJordanKazakhstanKenyaKorea, Rep.KuwaitLao PDRLate-demographic dividendLatin America & Caribbean Latin America & Caribbean (excluding high income)Latin America & the Caribbean (IDA & IBRD countries)LatviaLesothoLithuaniaLow & middle incomeLuxembourgMacao SAR, ChinaMacedonia, FYRMadagascarMalawiMalaysiaMaliMaltaMauritiusMexicoMiddle East & North Africa (excluding high income)Middle East & North Africa (IDA & IBRD countries)Middle incomeMoldovaMontenegroMoroccoMozambiqueMyanmarNepalNetherlandsNew ZealandNicaraguaNigerNigeriaNorth AmericaNorwayOECD membersOmanPakistanPanamaParaguayPhilippinesPolandPortugalPost-demographic dividendPuerto RicoQatarRomaniaRussian FederationRwandaSenegalSerbiaSeychellesSingaporeSlovak RepublicSloveniaSouth AfricaSouth AsiaSouth Asia (IDA & IBRD)SpainSri LankaSwedenSwitzerlandTanzaniaThailandTogoTunisiaTurkeyUgandaUkraineUnited KingdomUnited StatesUpper middle incomeUruguayUzbekistanVenezuela, RBVietnamWest Bank and GazaWorldZambiaZimbabwe

La ligne de temps

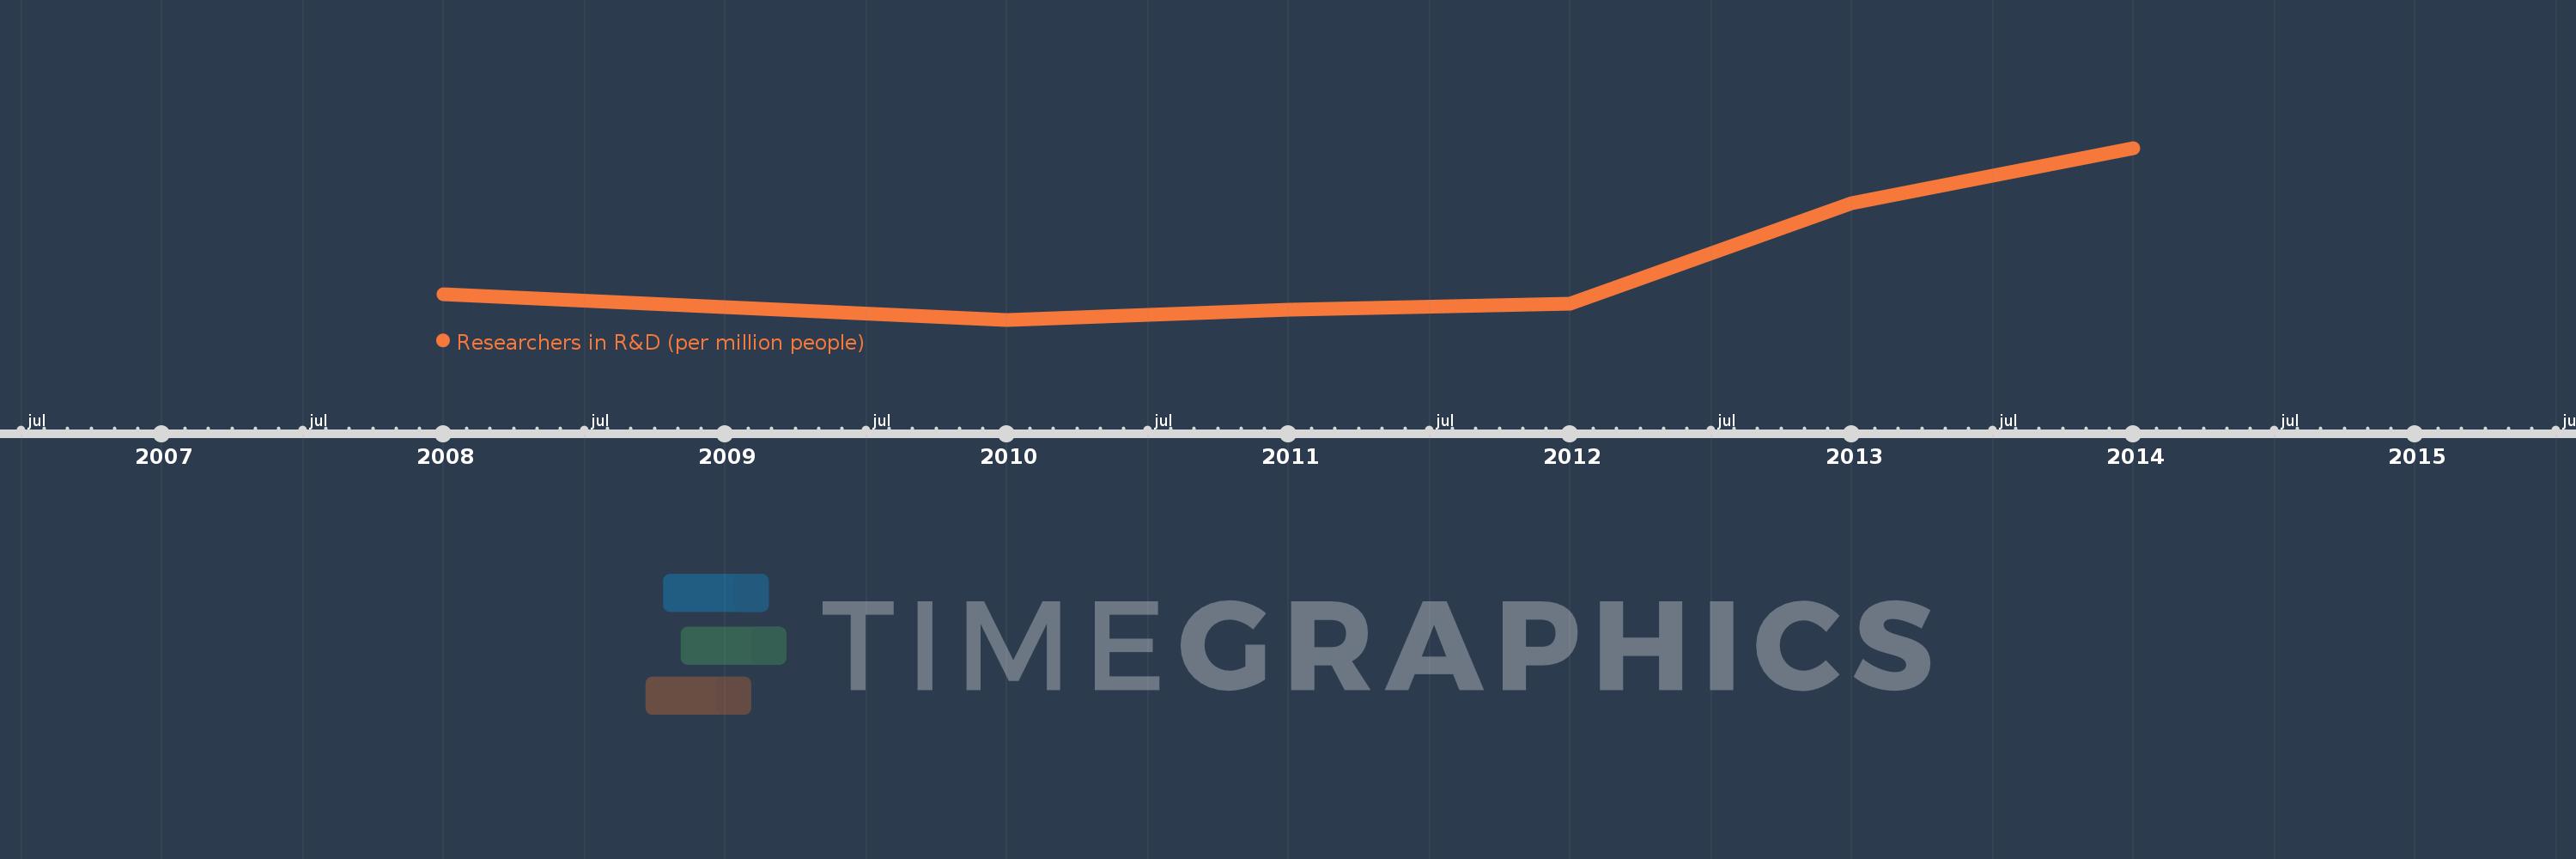
Cette échelle de temps montre un graphique de 2008 année à 2014 année Kazakhstan. Les données jusqu'à 2007 année ne sont pas présentés. Quantité d'observations actuelles selon dates: 7.

Source (désignation):

Les indicateurs du développement mondiale

Source (organisation):

United Nations Educational, Scientific, and Cultural Organization (UNESCO) Institute for Statistics.

Catégories:

Science & Technology

Dernière mise à jour

23 avr. 2017

Les indicateurs de changement de valeurs selon les années

En moyenne:
460.74
Minimum:
347.427
1 janv. 2010
Maximum:
734.055
1 janv. 2014
Pour la date d''observation
Valeur
Changement absolu
Le changement par rapport à la valeur précédente
1 janv. 2008
405.198
+405.198
0.0%
1 janv. 2009
375.221
-29.978
-7.4%
1 janv. 2010
347.427
-27.794
-7.41%
1 janv. 2011
369.207
+21.78
6.27%
1 janv. 2012
384.432
+15.225
4.12%
1 janv. 2013
609.638
+225.206
58.58%
1 janv. 2014
734.055
+124.416
20.41%

Classement des pays selon les statistiques actuelles par années