30
/fr/
AIzaSyAYiBZKx7MnpbEhh9jyipgxe19OcubqV5w
April 1, 2024
165600
Jordan
JOR
true
2
1
Tax revenue (current LCU)
2016,2015,2014,2013,2012,2011,2010,2009,2008,2007,2006,2005,2004,2003,2002,2001,2000,1999,1998,1997,1996,1995,1994,1993,1992,1991
Download
Bibliothèque de statistiques globales →Jordan →

Tax revenue (current LCU)

Cette statistique dans les autres pays:

AfghanistanAlbaniaAlgeriaAngolaAntigua and BarbudaArgentinaArmeniaAustraliaAustriaAzerbaijanBahamas, TheBahrainBangladeshBarbadosBelarusBelgiumBelizeBeninBhutanBoliviaBosnia and HerzegovinaBotswanaBrazilBulgariaBurkina FasoBurundiCabo VerdeCambodiaCanadaCentral African RepublicChileChinaColombiaCongo, Dem. Rep.Congo, Rep.Costa RicaCote d'IvoireCroatiaCyprusCzech RepublicDenmarkDominicaDominican RepublicEgypt, Arab Rep.El SalvadorEquatorial GuineaEstoniaEthiopiaFijiFinlandFranceGambia, TheGeorgiaGermanyGhanaGreeceGrenadaGuatemalaHondurasHong Kong SAR, ChinaHungaryIcelandIndiaIndonesiaIran, Islamic Rep.IraqIrelandIsraelItalyJamaicaJapanJordanKazakhstanKenyaKiribatiKorea, Rep.KuwaitKyrgyz RepublicLao PDRLatviaLebanonLesothoLiberiaLithuaniaLuxembourgMacao SAR, ChinaMacedonia, FYRMadagascarMalawiMalaysiaMaldivesMaliMaltaMauritiusMexicoMicronesia, Fed. Sts.MoldovaMongoliaMoroccoMozambiqueMyanmarNamibiaNepalNetherlandsNew ZealandNicaraguaNigeriaNorwayOmanPakistanPanamaPapua New GuineaParaguayPeruPhilippinesPolandPortugalQatarRomaniaRussian FederationRwandaSamoaSan MarinoSao Tome and PrincipeSenegalSerbiaSeychellesSierra LeoneSingaporeSlovak RepublicSloveniaSolomon IslandsSouth AfricaSpainSri LankaSt. Kitts and NevisSt. LuciaSt. Vincent and the GrenadinesSurinameSwazilandSwedenSwitzerlandSyrian Arab RepublicTajikistanTanzaniaThailandTimor-LesteTogoTrinidad and TobagoTunisiaTurkeyUgandaUkraineUnited Arab EmiratesUnited KingdomUnited StatesUruguayVanuatuVenezuela, RBVietnamWest Bank and GazaYemen, Rep.ZambiaZimbabwe

La ligne de temps

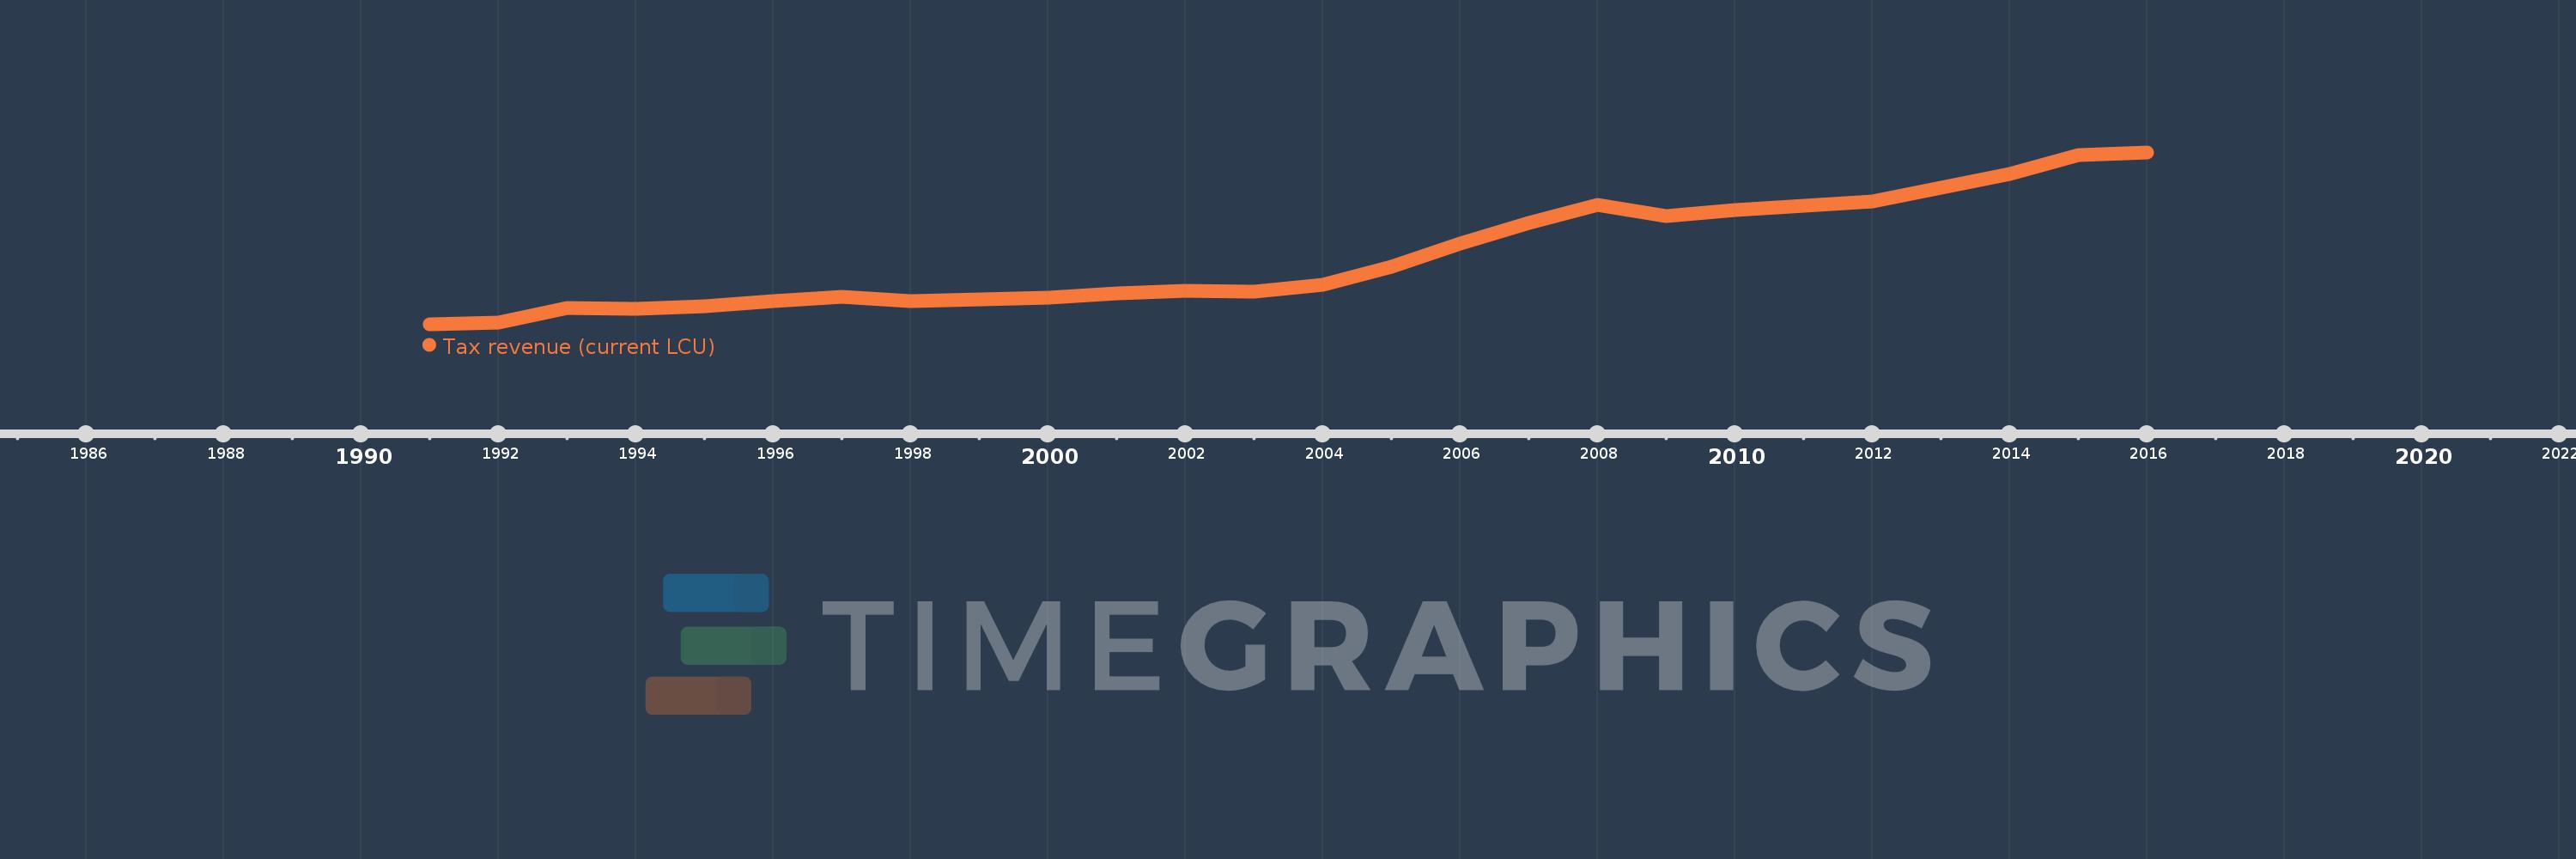
Cette échelle de temps montre un graphique de 1991 année à 2016 année Jordan. Les données jusqu'à 1990 année ne sont pas présentés. Quantité d'observations actuelles selon dates: 26.

Source (désignation):

Les indicateurs du développement mondiale

Source (organisation):

International Monetary Fund, Government Finance Statistics Yearbook and data files.

Catégories:

Public Sector

Dernière mise à jour

23 avr. 2017

Les indicateurs de changement de valeurs selon les années

En moyenne:
1.914 mds
Minimum:
497.18 mln.
1 janv. 1991
Maximum:
4.096 mds
1 janv. 2016
Pour la date d''observation
Valeur
Changement absolu
Le changement par rapport à la valeur précédente
1 janv. 1991
497.18 mln.
+497.18 mln.
0.0%
1 janv. 1992
530.96 mln.
+33.78 mln.
6.79%
1 janv. 1993
829.39 mln.
+298.43 mln.
56.21%
1 janv. 1994
812.47 mln.
-16.92 mln.
-2.04%
1 janv. 1995
871.06 mln.
+58.59 mln.
7.21%
1 janv. 1996
976.35 mln.
+105.29 mln.
12.09%
1 janv. 1997
1.065 mds
+88.96 mln.
9.11%
1 janv. 1998
978.95 mln.
-86.36 mln.
-8.11%
1 janv. 1999
1.017 mds
+37.74 mln.
3.86%
1 janv. 2000
1.046 mds
+29.69 mln.
2.92%
1 janv. 2001
1.14 mds
+93.26 mln.
8.91%
1 janv. 2002
1.189 mds
+49.13 mln.
4.31%
1 janv. 2003
1.188 mds
-1.07 mln.
-0.09%
1 janv. 2004
1.317 mds
+129.22 mln.
10.88%
1 janv. 2005
1.699 mds
+381.805 mln.
28.99%
1 janv. 2006
2.179 mds
+480.475 mln.
28.28%
1 janv. 2007
2.621 mds
+442.13 mln.
20.29%
1 janv. 2008
2.995 mds
+373.87 mln.
14.26%
1 janv. 2009
2.758 mds
-237.1 mln.
-7.92%
1 janv. 2010
2.88 mds
+121.8 mln.
4.42%
1 janv. 2011
2.986 mds
+106.0 mln.
3.68%
1 janv. 2012
3.062 mds
+76.3 mln.
2.56%
1 janv. 2013
3.351 mds
+289.2 mln.
9.44%
1 janv. 2014
3.652 mds
+301.0 mln.
8.98%
1 janv. 2015
4.037 mds
+384.8 mln.
10.54%
1 janv. 2016
4.096 mds
+58.9 mln.
1.46%

Classement des pays selon les statistiques actuelles par années