29
/fr/
fr
AIzaSyAYiBZKx7MnpbEhh9jyipgxe19OcubqV5w
April 1, 2024
163470
Japan
JPN
true
2
1
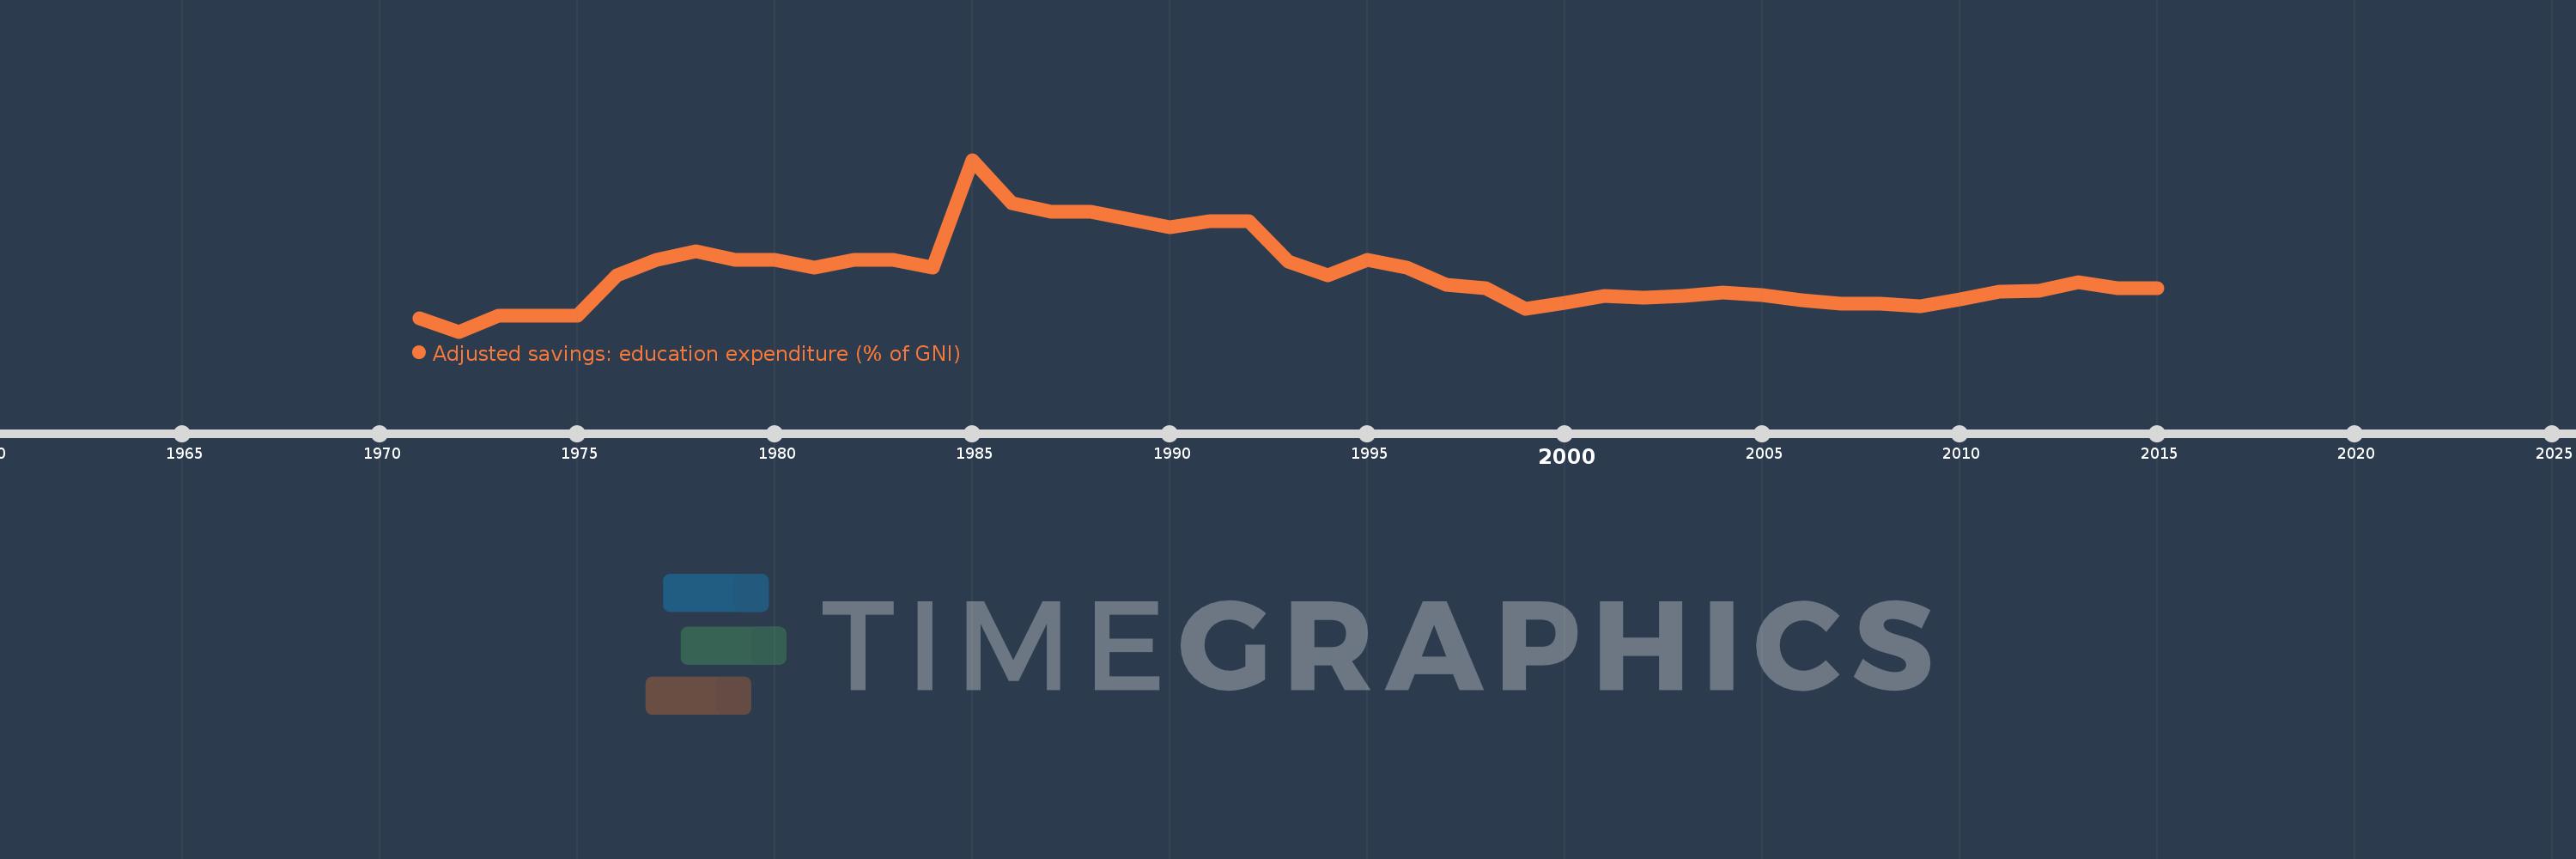
Adjusted savings: education expenditure (% of GNI)
2015,2014,2013,2012,2011,2010,2009,2008,2007,2006,2005,2004,2003,2002,2001,2000,1999,1998,1997,1996,1995,1994,1993,1992,1991,1990,1989,1988,1987,1986,1985,1984,1983,1982,1981,1980,1979,1978,1977,1976,1975,1974,1973,1972,1971
Cette statistique dans les autres pays:
AfghanistanAlbaniaAlgeriaAmerican SamoaAndorraAngolaAntigua and BarbudaArab WorldArgentinaArmeniaAustraliaAustriaAzerbaijanBahamas, TheBahrainBangladeshBarbadosBelarusBelgiumBelizeBeninBermudaBhutanBoliviaBotswanaBrazilBrunei DarussalamBulgariaBurkina FasoBurundiCabo VerdeCambodiaCameroonCanadaCaribbean small statesCentral African RepublicCentral Europe and the BalticsChadChileChinaColombiaComorosCongo, Dem. Rep.Congo, Rep.Costa RicaCote d'IvoireCroatiaCubaCyprusCzech RepublicDenmarkDjiboutiDominicaDominican RepublicEarly-demographic dividendEast Asia & PacificEast Asia & Pacific (excluding high income)East Asia & Pacific (IDA & IBRD countries)EcuadorEgypt, Arab Rep.El SalvadorEquatorial GuineaEritreaEstoniaEthiopiaEuro areaEurope & Central AsiaEurope & Central Asia (excluding high income)Europe & Central Asia (IDA & IBRD countries)European UnionFijiFinlandFragile and conflict affected situationsFranceFrench PolynesiaGabonGambia, TheGeorgiaGermanyGhanaGreeceGrenadaGuatemalaGuineaGuinea-BissauGuyanaHaitiHeavily indebted poor countries (HIPC)High incomeHondurasHong Kong SAR, ChinaHungaryIBRD onlyIcelandIDA & IBRD totalIDA blendIDA onlyIDA totalIndiaIndonesiaIran, Islamic Rep.IraqIrelandIsraelItalyJamaicaJapanJordanKazakhstanKenyaKiribatiKorea, Rep.KuwaitKyrgyz RepublicLao PDRLate-demographic dividendLatin America & Caribbean Latin America & Caribbean (excluding high income)Latin America & the Caribbean (IDA & IBRD countries)LatviaLeast developed countries: UN classificationLebanonLesothoLiberiaLibyaLiechtensteinLithuaniaLow & middle incomeLow incomeLower middle incomeLuxembourgMacao SAR, ChinaMacedonia, FYRMadagascarMalawiMalaysiaMaldivesMaliMaltaMarshall IslandsMauritaniaMauritiusMexicoMicronesia, Fed. Sts.Middle East & North AfricaMiddle East & North Africa (excluding high income)Middle East & North Africa (IDA & IBRD countries)Middle incomeMoldovaMonacoMongoliaMoroccoMozambiqueMyanmarNamibiaNepalNetherlandsNew CaledoniaNew ZealandNicaraguaNigerNigeriaNorth AmericaNorwayOECD membersOmanOther small statesPacific island small statesPakistanPanamaPapua New GuineaParaguayPeruPhilippinesPolandPortugalPost-demographic dividendPre-demographic dividendPuerto RicoQatarRomaniaRussian FederationRwandaSamoaSan MarinoSao Tome and PrincipeSaudi ArabiaSenegalSerbiaSeychellesSierra LeoneSingaporeSlovak RepublicSloveniaSmall statesSolomon IslandsSomaliaSouth AfricaSouth AsiaSouth Asia (IDA & IBRD)SpainSri LankaSt. Kitts and NevisSt. LuciaSt. Vincent and the GrenadinesSub-Saharan Africa Sub-Saharan Africa (excluding high income)Sub-Saharan Africa (IDA & IBRD countries)SudanSurinameSwazilandSwedenSwitzerlandSyrian Arab RepublicTajikistanTanzaniaThailandTimor-LesteTogoTongaTrinidad and TobagoTunisiaTurkeyTurkmenistanUgandaUkraineUnited KingdomUnited StatesUpper middle incomeUruguayUzbekistanVanuatuVenezuela, RBVietnamVirgin Islands (U.S.)WorldYemen, Rep.ZambiaZimbabwe La ligne de temps
Cette échelle de temps montre un graphique de 1971 année à 2015 année Japan. Les données jusqu'à 1970 année ne sont pas présentés. Quantité d'observations actuelles selon dates: 45.
Source (désignation):
Les indicateurs du développement mondiale
Source (organisation):
World Bank staff estimates using data from the United Nations Statistics Division's Statistical Yearbook, and the UNESCO Institute for Statistics online database.
Catégories:
Economy & Growth, Environment
Dernière mise à jour
23 avr. 2017
Les indicateurs de changement de valeurs selon les années
Maximum:
4.844
1 janv. 1985
Pour la date d''observation
Valeur
Changement absolu
Le changement par rapport à la valeur précédente
1 janv. 1971
2.868
+2.868
0.0%
1 janv. 1972
2.7
-0.168
-5.85%
1 janv. 1973
2.9
+0.2
7.41%
1 janv. 1976
3.4
+0.5
17.24%
1 janv. 1977
3.6
+0.2
5.88%
1 janv. 1978
3.7
+0.1
2.78%
1 janv. 1979
3.6
-0.1
-2.7%
1 janv. 1981
3.5
-0.1
-2.78%
1 janv. 1982
3.6
+0.1
2.86%
1 janv. 1984
3.5
-0.1
-2.78%
1 janv. 1985
4.844
+1.344
38.4%
1 janv. 1986
4.3
-0.544
-11.23%
1 janv. 1987
4.2
-0.1
-2.33%
1 janv. 1989
4.1
-0.1
-2.38%
1 janv. 1990
4.0
-0.1
-2.44%
1 janv. 1991
4.082
+0.082
2.06%
1 janv. 1992
4.082
0.0
0.0%
1 janv. 1993
3.572
-0.51
-12.49%
1 janv. 1994
3.4
-0.172
-4.83%
1 janv. 1995
3.6
+0.2
5.88%
1 janv. 1996
3.5
-0.1
-2.78%
1 janv. 1997
3.28
-0.22
-6.29%
1 janv. 1998
3.238
-0.042
-1.27%
1 janv. 1999
2.981
-0.258
-7.96%
1 janv. 2000
3.056
+0.075
2.53%
1 janv. 2001
3.149
+0.092
3.02%
1 janv. 2002
3.12
-0.028
-0.9%
1 janv. 2003
3.147
+0.026
0.85%
1 janv. 2004
3.185
+0.039
1.23%
1 janv. 2005
3.16
-0.025
-0.79%
1 janv. 2006
3.096
-0.064
-2.04%
1 janv. 2007
3.048
-0.048
-1.54%
1 janv. 2008
3.048
0.0
-0.01%
1 janv. 2009
3.019
-0.029
-0.94%
1 janv. 2010
3.106
+0.087
2.89%
1 janv. 2011
3.194
+0.087
2.81%
1 janv. 2012
3.206
+0.012
0.38%
1 janv. 2013
3.32
+0.114
3.57%
1 janv. 2014
3.245
-0.076
-2.28%
1 janv. 2015
3.245
0.0
0.0%
Classement des pays selon les statistiques actuelles par années


Commentaires: