29
/fr/
fr
AIzaSyAYiBZKx7MnpbEhh9jyipgxe19OcubqV5w
April 1, 2024
163241
Jamaica
JAM
true
2
1
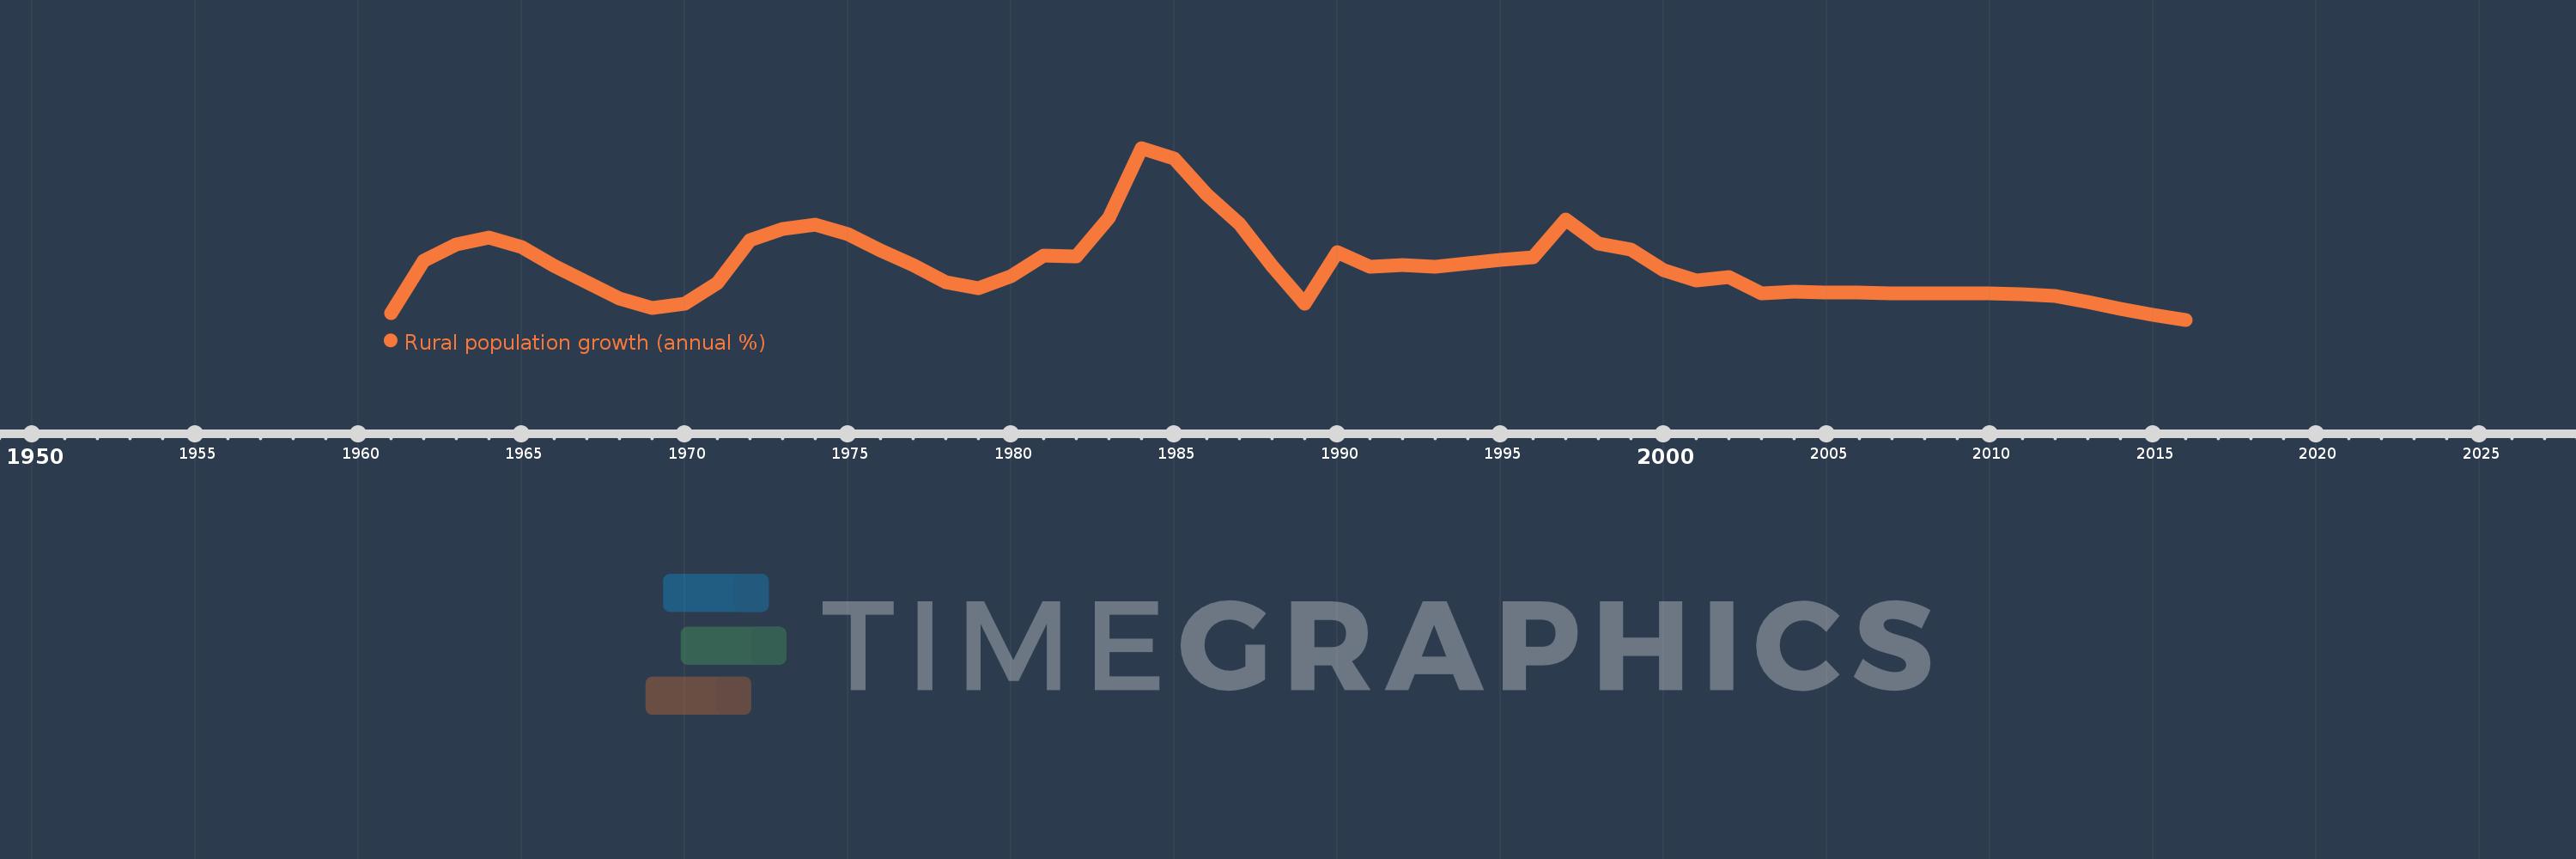
Rural population growth (annual %)
2016,2015,2014,2013,2012,2011,2010,2009,2008,2007,2006,2005,2004,2003,2002,2001,2000,1999,1998,1997,1996,1995,1994,1993,1992,1991,1990,1989,1988,1987,1986,1985,1984,1983,1982,1981,1980,1979,1978,1977,1976,1975,1974,1973,1972,1971,1970,1969,1968,1967,1966,1965,1964,1963,1962,1961
Cette statistique dans les autres pays:
AfghanistanAlbaniaAlgeriaAmerican SamoaAndorraAngolaAntigua and BarbudaArab WorldArgentinaArmeniaArubaAustraliaAustriaAzerbaijanBahamas, TheBahrainBangladeshBarbadosBelarusBelgiumBelizeBeninBhutanBoliviaBosnia and HerzegovinaBotswanaBrazilBritish Virgin IslandsBrunei DarussalamBulgariaBurkina FasoBurundiCabo VerdeCambodiaCameroonCanadaCaribbean small statesCentral African RepublicCentral Europe and the BalticsChadChannel IslandsChileChinaColombiaComorosCongo, Dem. Rep.Congo, Rep.Costa RicaCote d'IvoireCroatiaCubaCuracaoCyprusCzech RepublicDenmarkDjiboutiDominicaDominican RepublicEarly-demographic dividendEast Asia & PacificEast Asia & Pacific (excluding high income)East Asia & Pacific (IDA & IBRD countries)EcuadorEgypt, Arab Rep.El SalvadorEquatorial GuineaEritreaEstoniaEthiopiaEuro areaEurope & Central AsiaEurope & Central Asia (excluding high income)Europe & Central Asia (IDA & IBRD countries)European UnionFaroe IslandsFijiFinlandFragile and conflict affected situationsFranceFrench PolynesiaGabonGambia, TheGeorgiaGermanyGhanaGreeceGreenlandGrenadaGuamGuatemalaGuineaGuinea-BissauGuyanaHaitiHeavily indebted poor countries (HIPC)High incomeHondurasHong Kong SAR, ChinaHungaryIBRD onlyIcelandIDA & IBRD totalIDA blendIDA onlyIDA totalIndiaIndonesiaIran, Islamic Rep.IraqIrelandIsle of ManIsraelItalyJamaicaJapanJordanKazakhstanKenyaKiribatiKorea, Dem. People’s Rep.Korea, Rep.KuwaitKyrgyz RepublicLao PDRLate-demographic dividendLatin America & Caribbean Latin America & Caribbean (excluding high income)Latin America & the Caribbean (IDA & IBRD countries)LatviaLeast developed countries: UN classificationLebanonLesothoLiberiaLibyaLiechtensteinLithuaniaLow & middle incomeLow incomeLower middle incomeLuxembourgMacao SAR, ChinaMacedonia, FYRMadagascarMalawiMalaysiaMaldivesMaliMaltaMarshall IslandsMauritaniaMauritiusMexicoMicronesia, Fed. Sts.Middle East & North AfricaMiddle East & North Africa (excluding high income)Middle East & North Africa (IDA & IBRD countries)Middle incomeMoldovaMongoliaMontenegroMoroccoMozambiqueMyanmarNamibiaNauruNepalNetherlandsNew CaledoniaNew ZealandNicaraguaNigerNigeriaNorth AmericaNorthern Mariana IslandsNorwayOECD membersOmanOther small statesPacific island small statesPakistanPalauPanamaPapua New GuineaParaguayPeruPhilippinesPolandPortugalPost-demographic dividendPre-demographic dividendPuerto RicoQatarRomaniaRussian FederationRwandaSamoaSan MarinoSao Tome and PrincipeSaudi ArabiaSenegalSerbiaSeychellesSierra LeoneSlovak RepublicSloveniaSmall statesSolomon IslandsSomaliaSouth AfricaSouth AsiaSouth Asia (IDA & IBRD)South SudanSpainSri LankaSt. Kitts and NevisSt. LuciaSt. Vincent and the GrenadinesSub-Saharan Africa Sub-Saharan Africa (excluding high income)Sub-Saharan Africa (IDA & IBRD countries)SudanSurinameSwazilandSwedenSwitzerlandSyrian Arab RepublicTajikistanTanzaniaThailandTimor-LesteTogoTongaTrinidad and TobagoTunisiaTurkeyTurkmenistanTurks and Caicos IslandsTuvaluUgandaUkraineUnited Arab EmiratesUnited KingdomUnited StatesUpper middle incomeUruguayUzbekistanVanuatuVenezuela, RBVietnamVirgin Islands (U.S.)West Bank and GazaWorldYemen, Rep.ZambiaZimbabwe La ligne de temps
Cette échelle de temps montre un graphique de 1961 année à 2016 année Jamaica. Les données jusqu'à 1960 année ne sont pas présentés. Quantité d'observations actuelles selon dates: 56.
Source (désignation):
Les indicateurs du développement mondiale
Source (organisation):
World Bank Staff estimates based on United Nations, World Urbanization Prospects.
Catégories:
Agriculture & Rural Development
Dernière mise à jour
23 avr. 2017
Les indicateurs de changement de valeurs selon les années
Minimum:
-0.314
1 janv. 2016
Maximum:
1.443
1 janv. 1984
Pour la date d''observation
Valeur
Changement absolu
Le changement par rapport à la valeur précédente
1 janv. 1961
-0.245
-0.245
0.0%
1 janv. 1962
0.287
+0.532
-217.14%
1 janv. 1963
0.46
+0.173
60.36%
1 janv. 1964
0.528
+0.068
14.83%
1 janv. 1965
0.426
-0.102
-19.37%
1 janv. 1966
0.237
-0.189
-44.28%
1 janv. 1967
0.072
-0.165
-69.59%
1 janv. 1968
-0.099
-0.171
-237.05%
1 janv. 1969
-0.194
-0.095
95.78%
1 janv. 1970
-0.149
+0.045
-23.19%
1 janv. 1971
0.063
+0.211
-142.2%
1 janv. 1972
0.501
+0.438
697.6%
1 janv. 1973
0.618
+0.118
23.48%
1 janv. 1974
0.655
+0.037
5.95%
1 janv. 1975
0.562
-0.093
-14.25%
1 janv. 1976
0.396
-0.165
-29.45%
1 janv. 1977
0.244
-0.152
-38.42%
1 janv. 1978
0.074
-0.17
-69.57%
1 janv. 1979
0.012
-0.062
-83.2%
1 janv. 1980
0.13
+0.117
938.98%
1 janv. 1981
0.339
+0.209
161.32%
1 janv. 1982
0.332
-0.007
-1.94%
1 janv. 1983
0.728
+0.396
119.35%
1 janv. 1984
1.443
+0.715
98.18%
1 janv. 1985
1.337
-0.107
-7.38%
1 janv. 1986
0.964
-0.372
-27.85%
1 janv. 1987
0.667
-0.298
-30.87%
1 janv. 1988
0.234
-0.433
-64.94%
1 janv. 1989
-0.153
-0.387
-165.47%
1 janv. 1990
0.381
+0.534
-348.93%
1 janv. 1991
0.231
-0.15
-39.33%
1 janv. 1992
0.249
+0.018
7.67%
1 janv. 1993
0.226
-0.023
-9.05%
1 janv. 1994
0.259
+0.033
14.52%
1 janv. 1995
0.294
+0.035
13.46%
1 janv. 1996
0.325
+0.031
10.48%
1 janv. 1997
0.712
+0.387
119.25%
1 janv. 1998
0.468
-0.244
-34.32%
1 janv. 1999
0.4
-0.067
-14.43%
1 janv. 2000
0.19
-0.21
-52.5%
1 janv. 2001
0.088
-0.102
-53.7%
1 janv. 2002
0.125
+0.037
42.2%
1 janv. 2003
-0.042
-0.168
-133.83%
1 janv. 2004
-0.03
+0.012
-29.46%
1 janv. 2005
-0.037
-0.007
22.83%
1 janv. 2006
-0.035
+0.002
-4.55%
1 janv. 2007
-0.041
-0.006
15.83%
1 janv. 2008
-0.041
-0.001
2.02%
1 janv. 2009
-0.046
-0.004
10.71%
1 janv. 2010
-0.047
-0.001
1.62%
1 janv. 2011
-0.05
-0.003
7.29%
1 janv. 2012
-0.071
-0.021
41.4%
1 janv. 2013
-0.134
-0.063
89.5%
1 janv. 2014
-0.203
-0.07
52.0%
1 janv. 2015
-0.266
-0.063
30.88%
1 janv. 2016
-0.314
-0.048
17.93%
Classement des pays selon les statistiques actuelles par années


Commentaires: