29
/fr/
fr
AIzaSyAYiBZKx7MnpbEhh9jyipgxe19OcubqV5w
April 1, 2024
161050
Israel
ISR
true
2
1
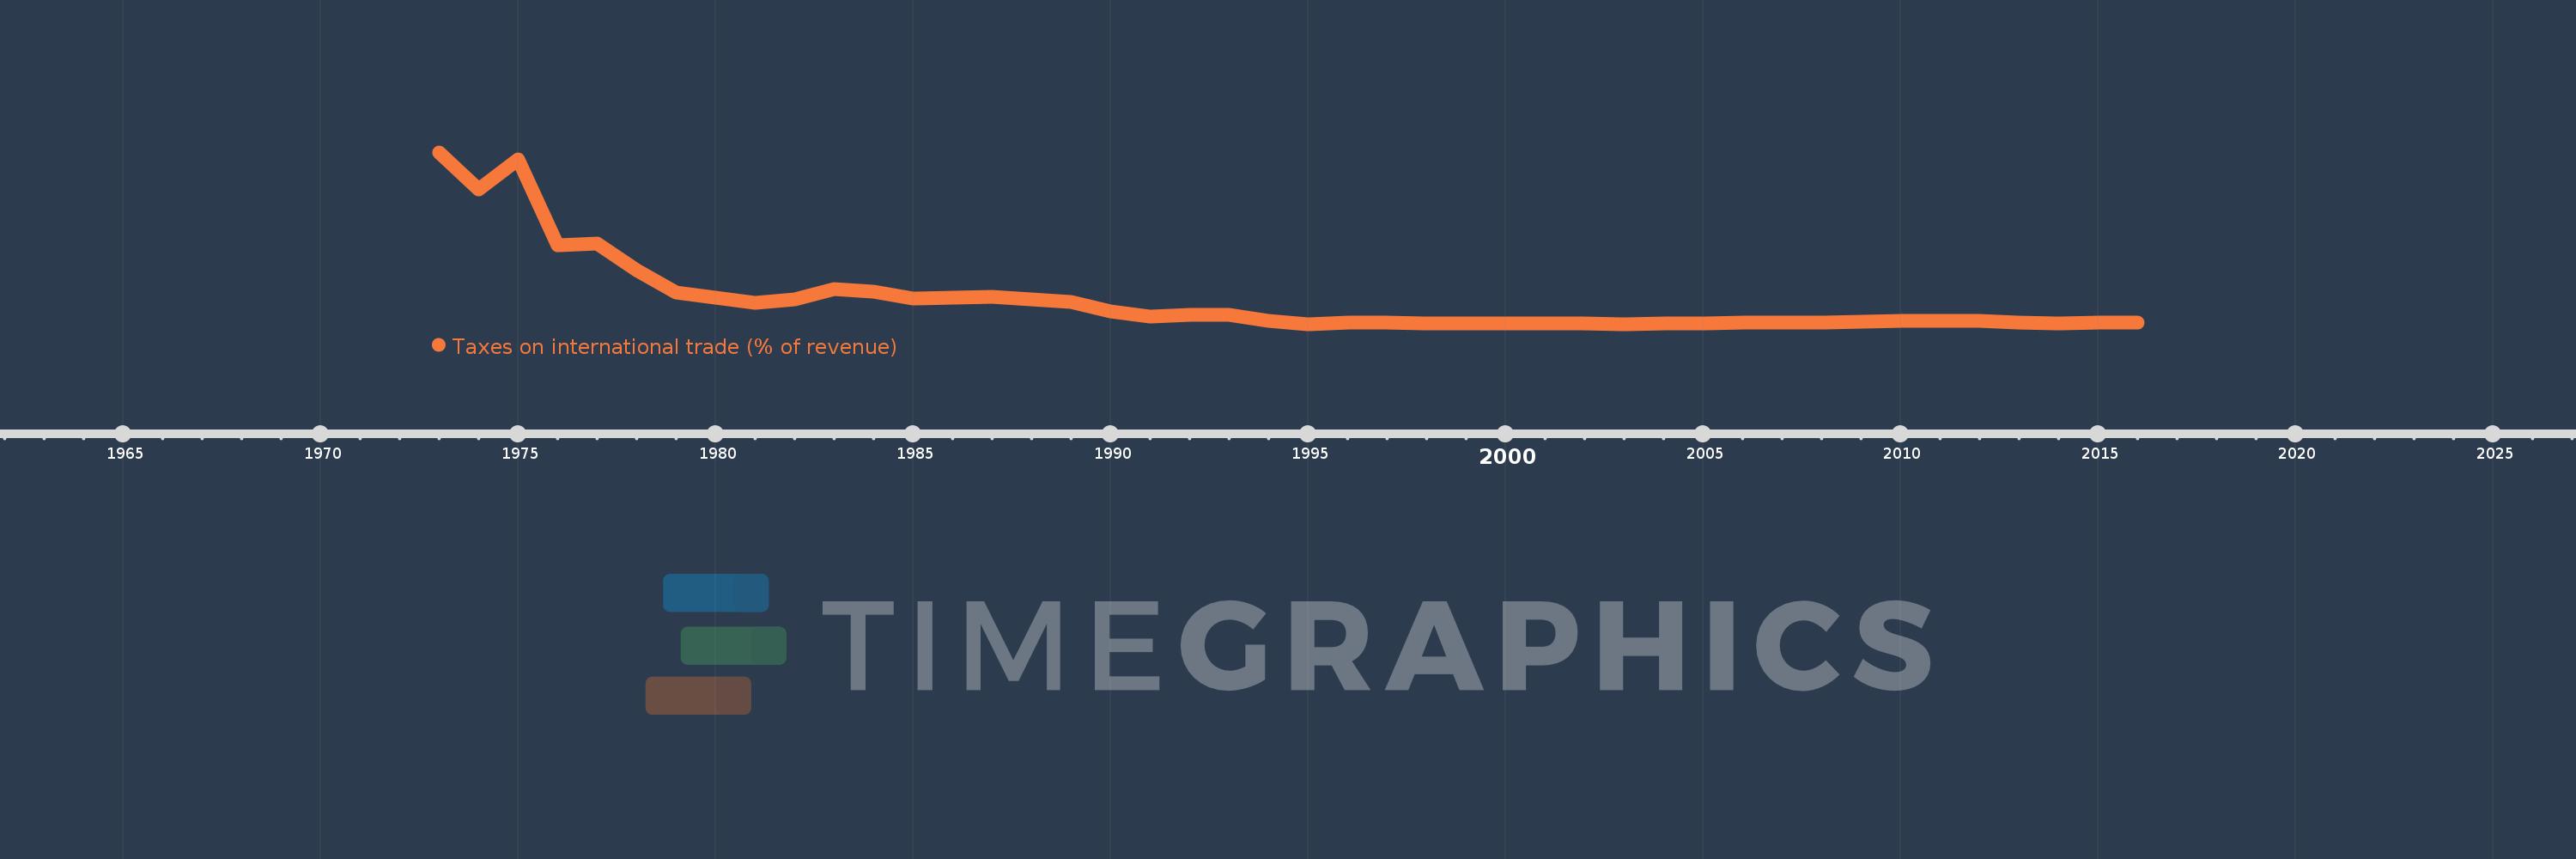
Taxes on international trade (% of revenue)
2016,2015,2014,2013,2012,2011,2010,2009,2008,2007,2006,2005,2004,2003,2002,2001,2000,1999,1998,1997,1996,1995,1994,1993,1992,1991,1990,1989,1988,1987,1986,1985,1984,1983,1982,1981,1980,1979,1978,1977,1976,1975,1974,1973
Cette statistique dans les autres pays:
AfghanistanAlbaniaAlgeriaAngolaAntigua and BarbudaArab WorldArgentinaArmeniaAustraliaAustriaAzerbaijanBahamas, TheBahrainBangladeshBarbadosBelarusBelizeBeninBhutanBoliviaBosnia and HerzegovinaBotswanaBrazilBulgariaBurkina FasoBurundiCabo VerdeCambodiaCanadaCaribbean small statesCentral African RepublicCentral Europe and the BalticsChileChinaColombiaCongo, Dem. Rep.Congo, Rep.Costa RicaCote d'IvoireCroatiaCyprusCzech RepublicDenmarkDominicaDominican RepublicEarly-demographic dividendEast Asia & PacificEast Asia & Pacific (excluding high income)East Asia & Pacific (IDA & IBRD countries)Egypt, Arab Rep.El SalvadorEquatorial GuineaEstoniaEthiopiaEuro areaEurope & Central AsiaEurope & Central Asia (excluding high income)Europe & Central Asia (IDA & IBRD countries)European UnionFijiFinlandFranceGambia, TheGeorgiaGermanyGhanaGreeceGrenadaGuatemalaHeavily indebted poor countries (HIPC)High incomeHondurasHong Kong SAR, ChinaHungaryIBRD onlyIcelandIDA & IBRD totalIDA blendIDA onlyIDA totalIndiaIndonesiaIran, Islamic Rep.IraqIrelandIsraelItalyJamaicaJapanJordanKazakhstanKenyaKiribatiKorea, Rep.KuwaitKyrgyz RepublicLao PDRLate-demographic dividendLatin America & Caribbean Latin America & Caribbean (excluding high income)Latin America & the Caribbean (IDA & IBRD countries)LatviaLeast developed countries: UN classificationLebanonLesothoLiberiaLithuaniaLow & middle incomeLow incomeLower middle incomeLuxembourgMacedonia, FYRMadagascarMalawiMalaysiaMaldivesMaliMaltaMauritiusMexicoMicronesia, Fed. Sts.Middle East & North AfricaMiddle East & North Africa (excluding high income)Middle East & North Africa (IDA & IBRD countries)Middle incomeMoldovaMongoliaMoroccoMozambiqueMyanmarNamibiaNepalNetherlandsNew ZealandNicaraguaNorth AmericaNorwayOECD membersOmanOther small statesPakistanPanamaPapua New GuineaParaguayPeruPhilippinesPolandPortugalPost-demographic dividendPre-demographic dividendQatarRomaniaRussian FederationRwandaSamoaSan MarinoSao Tome and PrincipeSenegalSerbiaSeychellesSierra LeoneSingaporeSlovak RepublicSloveniaSmall statesSolomon IslandsSouth AfricaSouth AsiaSouth Asia (IDA & IBRD)SpainSri LankaSt. Kitts and NevisSt. LuciaSub-Saharan Africa Sub-Saharan Africa (excluding high income)Sub-Saharan Africa (IDA & IBRD countries)SurinameSwazilandSwedenSwitzerlandSyrian Arab RepublicTajikistanTanzaniaThailandTimor-LesteTogoTrinidad and TobagoTunisiaTurkeyUgandaUkraineUnited Arab EmiratesUnited KingdomUnited StatesUpper middle incomeUruguayVanuatuVenezuela, RBVietnamWest Bank and GazaWorldYemen, Rep.ZambiaZimbabwe La ligne de temps
Cette échelle de temps montre un graphique de 1973 année à 2016 année Israel. Les données jusqu'à 1972 année ne sont pas présentés. Quantité d'observations actuelles selon dates: 44.
Source (désignation):
Les indicateurs du développement mondiale
Source (organisation):
International Monetary Fund, Government Finance Statistics Yearbook and data files.
Catégories:
Public Sector
Dernière mise à jour
23 avr. 2017
Les indicateurs de changement de valeurs selon les années
Minimum:
0.564
1 janv. 1995
Pour la date d''observation
Valeur
Changement absolu
Le changement par rapport à la valeur précédente
1 janv. 1973
20.0
+20.0
0.0%
1 janv. 1974
15.789
-4.211
-21.05%
1 janv. 1975
19.231
+3.441
21.79%
1 janv. 1976
9.524
-9.707
-50.48%
1 janv. 1977
9.677
+0.154
1.61%
1 janv. 1978
6.667
-3.011
-31.11%
1 janv. 1979
4.167
-2.5
-37.5%
1 janv. 1980
3.607
-0.56
-13.44%
1 janv. 1981
3.013
-0.594
-16.46%
1 janv. 1982
3.354
+0.342
11.34%
1 janv. 1983
4.562
+1.208
36.0%
1 janv. 1984
4.259
-0.303
-6.65%
1 janv. 1985
3.443
-0.816
-19.15%
1 janv. 1986
3.551
+0.108
3.15%
1 janv. 1987
3.636
+0.084
2.38%
1 janv. 1988
3.372
-0.264
-7.26%
1 janv. 1989
3.102
-0.27
-8.01%
1 janv. 1990
2.006
-1.096
-35.33%
1 janv. 1991
1.433
-0.573
-28.56%
1 janv. 1992
1.614
+0.181
12.63%
1 janv. 1993
1.61
-0.004
-0.27%
1 janv. 1994
0.915
-0.694
-43.13%
1 janv. 1995
0.564
-0.352
-38.41%
1 janv. 1996
0.794
+0.23
40.81%
1 janv. 1997
0.714
-0.079
-10.01%
1 janv. 1998
0.689
-0.026
-3.62%
1 janv. 1999
0.638
-0.051
-7.42%
1 janv. 2000
0.672
+0.034
5.35%
1 janv. 2001
0.641
-0.031
-4.55%
1 janv. 2002
0.604
-0.037
-5.83%
1 janv. 2003
0.602
-0.002
-0.27%
1 janv. 2004
0.617
+0.015
2.42%
1 janv. 2005
0.691
+0.074
12.02%
1 janv. 2006
0.724
+0.033
4.74%
1 janv. 2007
0.708
-0.016
-2.2%
1 janv. 2008
0.791
+0.083
11.79%
1 janv. 2009
0.861
+0.07
8.81%
1 janv. 2010
0.898
+0.037
4.32%
1 janv. 2011
0.911
+0.013
1.41%
1 janv. 2012
0.919
+0.008
0.89%
1 janv. 2013
0.776
-0.143
-15.55%
1 janv. 2014
0.65
-0.126
-16.28%
1 janv. 2015
0.741
+0.092
14.14%
1 janv. 2016
0.725
-0.016
-2.17%
Classement des pays selon les statistiques actuelles par années


Commentaires: