29
/fr/
fr
AIzaSyAYiBZKx7MnpbEhh9jyipgxe19OcubqV5w
April 1, 2024
159870
Ireland
IRL
true
2
1
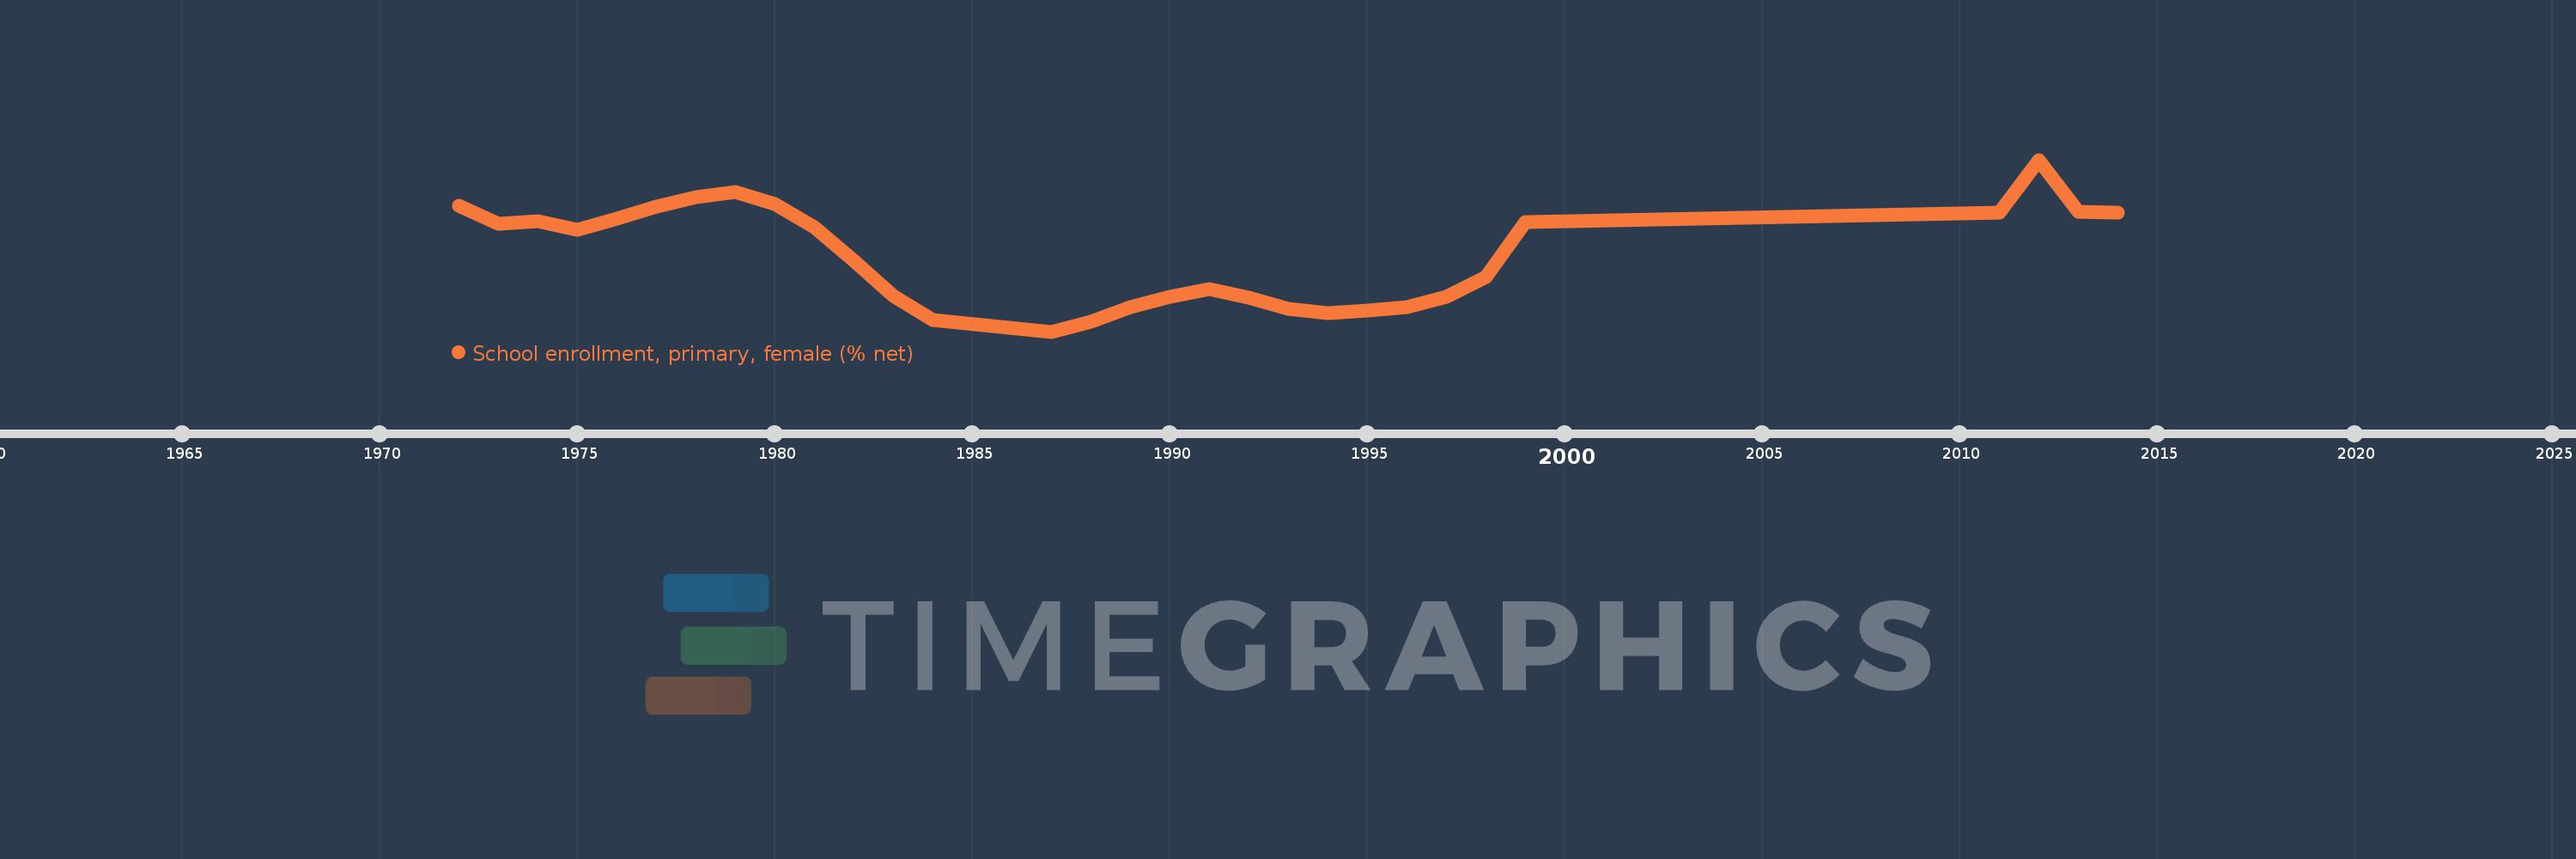
School enrollment, primary, female (% net)
2014,2013,2012,2011,1999,1998,1997,1996,1995,1994,1993,1992,1991,1990,1989,1988,1987,1984,1983,1982,1981,1980,1979,1978,1977,1976,1975,1974,1973,1972
Cette statistique dans les autres pays:
AfghanistanAlbaniaAlgeriaAngolaAntigua and BarbudaArab WorldArgentinaArmeniaArubaAustraliaAustriaAzerbaijanBahamas, TheBahrainBangladeshBarbadosBelarusBelgiumBelizeBeninBermudaBhutanBoliviaBosnia and HerzegovinaBotswanaBrazilBrunei DarussalamBulgariaBurkina FasoBurundiCabo VerdeCambodiaCameroonCanadaCaribbean small statesCentral African RepublicCentral Europe and the BalticsChadChileChinaColombiaComorosCongo, Dem. Rep.Congo, Rep.Costa RicaCote d'IvoireCroatiaCubaCyprusDenmarkDjiboutiDominicaDominican RepublicEarly-demographic dividendEast Asia & PacificEast Asia & Pacific (excluding high income)East Asia & Pacific (IDA & IBRD countries)EcuadorEgypt, Arab Rep.El SalvadorEquatorial GuineaEritreaEstoniaEthiopiaEuro areaEurope & Central AsiaEurope & Central Asia (excluding high income)Europe & Central Asia (IDA & IBRD countries)European UnionFijiFinlandFragile and conflict affected situationsFranceGabonGambia, TheGeorgiaGhanaGreeceGrenadaGuatemalaGuineaGuinea-BissauGuyanaHaitiHeavily indebted poor countries (HIPC)High incomeHondurasHong Kong SAR, ChinaHungaryIBRD onlyIcelandIDA & IBRD totalIDA blendIDA onlyIDA totalIndiaIndonesiaIran, Islamic Rep.IraqIrelandIsraelItalyJamaicaJapanJordanKazakhstanKenyaKiribatiKorea, Dem. People’s Rep.Korea, Rep.KuwaitKyrgyz RepublicLao PDRLate-demographic dividendLatin America & Caribbean Latin America & Caribbean (excluding high income)Latin America & the Caribbean (IDA & IBRD countries)LatviaLeast developed countries: UN classificationLebanonLesothoLiberiaLibyaLiechtensteinLithuaniaLow & middle incomeLow incomeLower middle incomeLuxembourgMacao SAR, ChinaMacedonia, FYRMadagascarMalawiMaldivesMaliMaltaMarshall IslandsMauritaniaMauritiusMexicoMicronesia, Fed. Sts.Middle East & North AfricaMiddle East & North Africa (excluding high income)Middle East & North Africa (IDA & IBRD countries)Middle incomeMoldovaMongoliaMontenegroMoroccoMozambiqueMyanmarNamibiaNauruNepalNetherlandsNew ZealandNicaraguaNigerNigeriaNorth AmericaNorwayOECD membersOmanOther small statesPacific island small statesPakistanPanamaPapua New GuineaParaguayPeruPhilippinesPolandPortugalPost-demographic dividendPre-demographic dividendPuerto RicoQatarRomaniaRussian FederationRwandaSamoaSan MarinoSao Tome and PrincipeSaudi ArabiaSenegalSerbiaSeychellesSierra LeoneSloveniaSmall statesSolomon IslandsSomaliaSouth AfricaSouth AsiaSouth Asia (IDA & IBRD)South SudanSpainSri LankaSt. Kitts and NevisSt. LuciaSt. Vincent and the GrenadinesSub-Saharan Africa Sub-Saharan Africa (excluding high income)Sub-Saharan Africa (IDA & IBRD countries)SudanSurinameSwazilandSwedenSwitzerlandSyrian Arab RepublicTajikistanTanzaniaThailandTimor-LesteTogoTongaTrinidad and TobagoTunisiaTurkeyTuvaluUgandaUkraineUnited Arab EmiratesUnited KingdomUnited StatesUpper middle incomeUruguayUzbekistanVanuatuVenezuela, RBWest Bank and GazaWorldYemen, Rep.ZambiaZimbabwe La ligne de temps
Cette échelle de temps montre un graphique de 1972 année à 2014 année Ireland. Les données jusqu'à 1971 année ne sont pas présentés. Quantité d'observations actuelles selon dates: 30.
Source (désignation):
Les indicateurs du développement mondiale
Source (organisation):
United Nations Educational, Scientific, and Cultural Organization (UNESCO) Institute for Statistics.
Catégories:
Education, Gender
Dernière mise à jour
23 avr. 2017
Les indicateurs de changement de valeurs selon les années
Minimum:
85.686
1 janv. 1987
Maximum:
99.135
1 janv. 2012
Pour la date d''observation
Valeur
Changement absolu
Le changement par rapport à la valeur précédente
1 janv. 1972
95.542
+95.542
0.0%
1 janv. 1973
94.094
-1.447
-1.51%
1 janv. 1974
94.327
+0.232
0.25%
1 janv. 1975
93.678
-0.649
-0.69%
1 janv. 1976
94.506
+0.828
0.88%
1 janv. 1977
95.502
+0.996
1.05%
1 janv. 1978
96.218
+0.716
0.75%
1 janv. 1979
96.643
+0.425
0.44%
1 janv. 1980
95.686
-0.957
-0.99%
1 janv. 1981
93.854
-1.832
-1.91%
1 janv. 1982
91.216
-2.638
-2.81%
1 janv. 1983
88.451
-2.765
-3.03%
1 janv. 1984
86.602
-1.849
-2.09%
1 janv. 1987
85.686
-0.916
-1.06%
1 janv. 1988
86.463
+0.777
0.91%
1 janv. 1989
87.577
+1.114
1.29%
1 janv. 1990
88.383
+0.806
0.92%
1 janv. 1991
89.001
+0.618
0.7%
1 janv. 1992
88.354
-0.646
-0.73%
1 janv. 1993
87.437
-0.917
-1.04%
1 janv. 1994
87.157
-0.28
-0.32%
1 janv. 1995
87.306
+0.149
0.17%
1 janv. 1996
87.622
+0.316
0.36%
1 janv. 1997
88.411
+0.789
0.9%
1 janv. 1998
89.964
+1.553
1.76%
1 janv. 1999
94.261
+4.297
4.78%
1 janv. 2011
94.999
+0.738
0.78%
1 janv. 2012
99.135
+4.136
4.35%
1 janv. 2013
95.091
-4.043
-4.08%
1 janv. 2014
94.97
-0.121
-0.13%
Classement des pays selon les statistiques actuelles par années


Commentaires: