29
/fr/
fr
AIzaSyAYiBZKx7MnpbEhh9jyipgxe19OcubqV5w
April 1, 2024
157572
Iran, Islamic Rep.
IRN
true
2
1
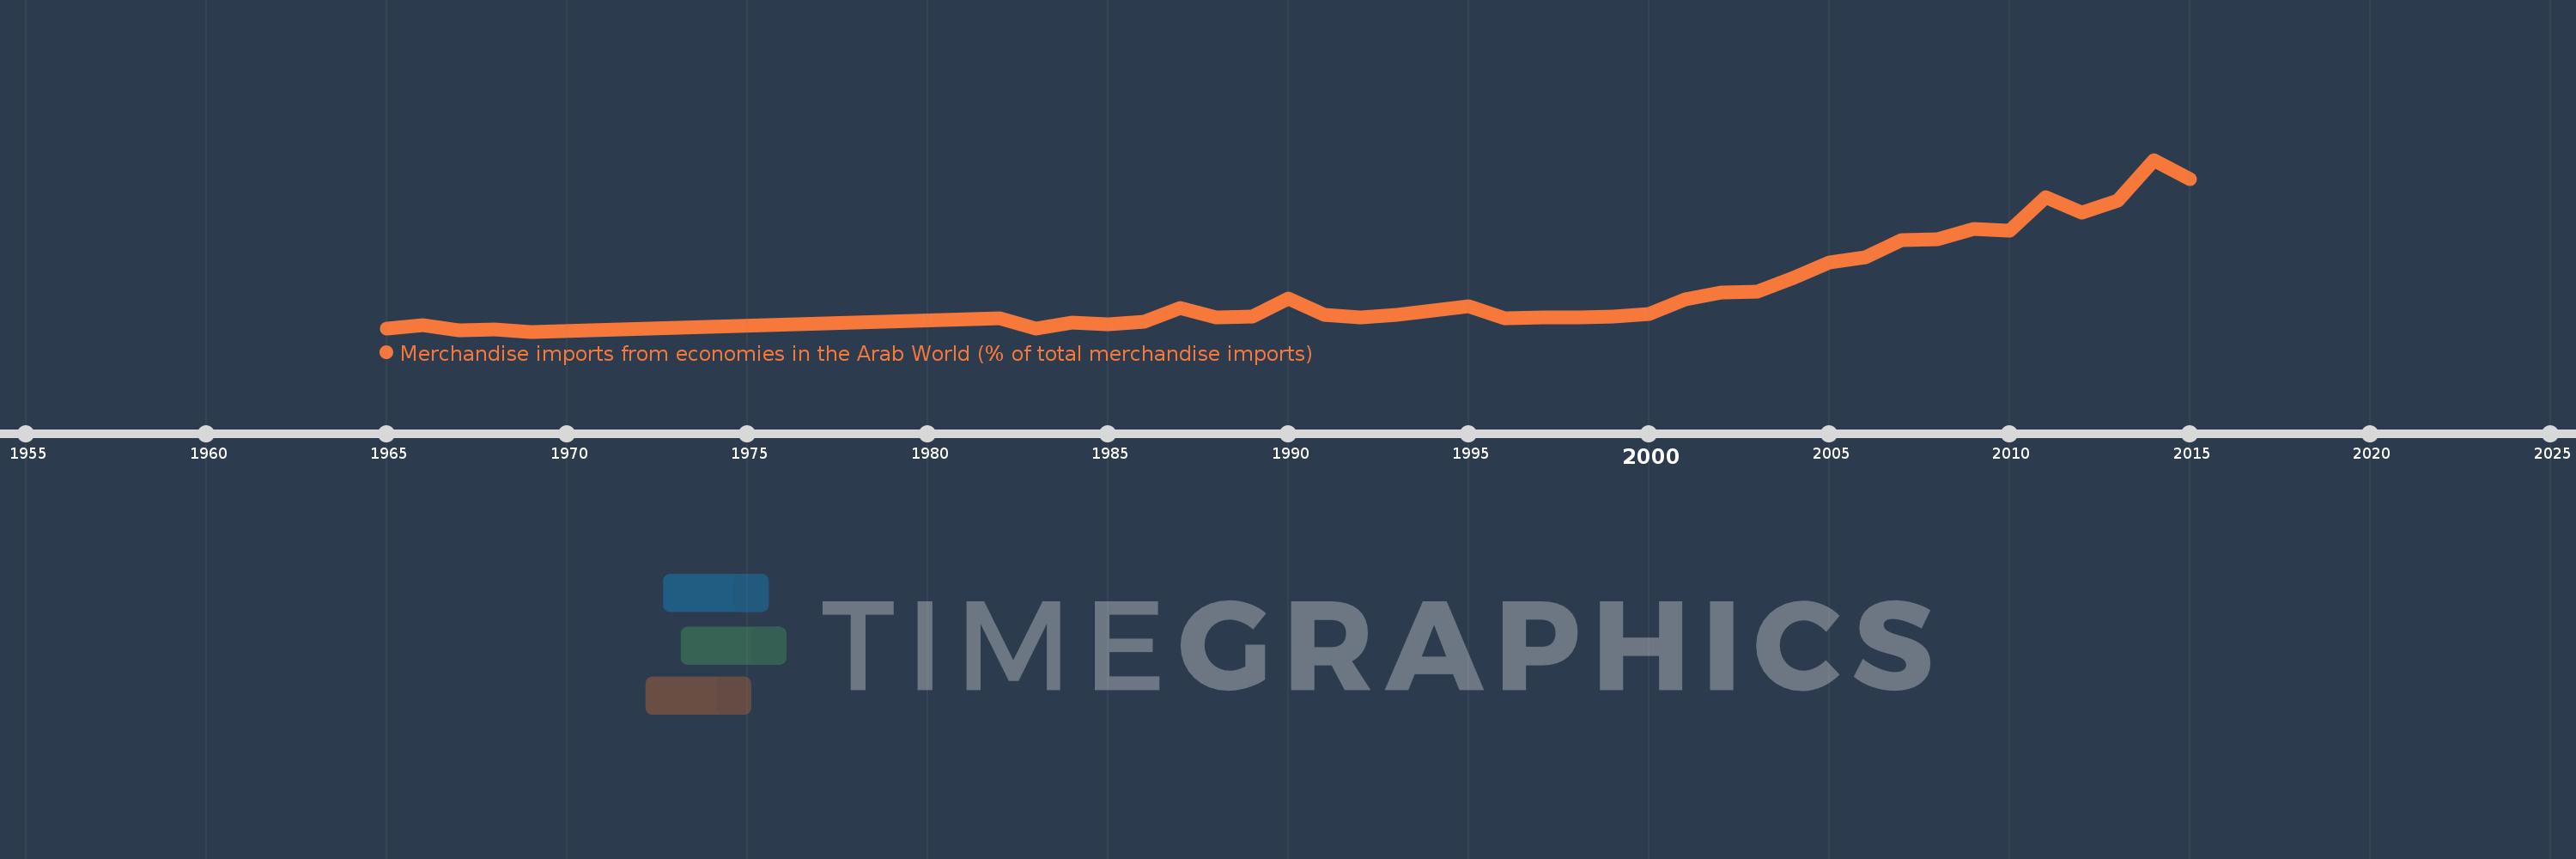
Merchandise imports from economies in the Arab World (% of total merchandise imports)
2015,2014,2013,2012,2011,2010,2009,2008,2007,2006,2005,2004,2003,2002,2001,2000,1999,1998,1997,1996,1995,1994,1993,1992,1991,1990,1989,1988,1987,1986,1985,1984,1983,1982,1969,1968,1967,1966,1965
Cette statistique dans les autres pays:
AfghanistanAlbaniaAlgeriaAngolaArab WorldArgentinaArmeniaArubaAustraliaAustriaAzerbaijanBahamas, TheBahrainBangladeshBarbadosBelarusBelgiumBelizeBeninBermudaBoliviaBrazilBrunei DarussalamBulgariaBurkina FasoBurundiCabo VerdeCambodiaCameroonCanadaCaribbean small statesCentral African RepublicCentral Europe and the BalticsChadChileChinaColombiaComorosCongo, Dem. Rep.Congo, Rep.Costa RicaCote d'IvoireCroatiaCubaCyprusCzech RepublicDenmarkDjiboutiDominicaDominican RepublicEarly-demographic dividendEast Asia & PacificEast Asia & Pacific (excluding high income)East Asia & Pacific (IDA & IBRD countries)EcuadorEgypt, Arab Rep.El SalvadorEstoniaEthiopiaEuro areaEurope & Central AsiaEurope & Central Asia (excluding high income)Europe & Central Asia (IDA & IBRD countries)European UnionFijiFinlandFragile and conflict affected situationsFranceFrench PolynesiaGabonGambia, TheGeorgiaGermanyGhanaGreeceGreenlandGrenadaGuatemalaGuineaGuinea-BissauGuyanaHaitiHeavily indebted poor countries (HIPC)High incomeHondurasHong Kong SAR, ChinaHungaryIBRD onlyIcelandIDA & IBRD totalIDA blendIDA onlyIDA totalIndiaIndonesiaIran, Islamic Rep.IraqIrelandItalyJamaicaJapanJordanKazakhstanKenyaKorea, Dem. People’s Rep.Korea, Rep.KuwaitKyrgyz RepublicLao PDRLate-demographic dividendLatin America & Caribbean Latin America & Caribbean (excluding high income)Latin America & the Caribbean (IDA & IBRD countries)LatviaLeast developed countries: UN classificationLebanonLiberiaLibyaLithuaniaLow & middle incomeLow incomeLower middle incomeLuxembourgMacao SAR, ChinaMacedonia, FYRMadagascarMalawiMalaysiaMaldivesMaliMaltaMauritaniaMauritiusMexicoMiddle East & North AfricaMiddle East & North Africa (excluding high income)Middle East & North Africa (IDA & IBRD countries)Middle incomeMoldovaMongoliaMontenegroMoroccoMozambiqueMyanmarNepalNetherlandsNew CaledoniaNew ZealandNicaraguaNigerNigeriaNorth AmericaNorwayOECD membersOmanOther small statesPacific island small statesPakistanPanamaPapua New GuineaParaguayPeruPhilippinesPolandPortugalPost-demographic dividendPre-demographic dividendQatarRomaniaRussian FederationRwandaSaudi ArabiaSenegalSerbiaSeychellesSierra LeoneSingaporeSlovak RepublicSloveniaSmall statesSomaliaSouth AfricaSouth AsiaSouth Asia (IDA & IBRD)SpainSri LankaSt. LuciaSt. Vincent and the GrenadinesSub-Saharan Africa Sub-Saharan Africa (excluding high income)Sub-Saharan Africa (IDA & IBRD countries)SudanSurinameSwedenSwitzerlandSyrian Arab RepublicTajikistanTanzaniaThailandTogoTrinidad and TobagoTunisiaTurkeyTurkmenistanUgandaUkraineUnited Arab EmiratesUnited KingdomUnited StatesUpper middle incomeUruguayVenezuela, RBVietnamWorldYemen, Rep.ZambiaZimbabwe La ligne de temps
Cette échelle de temps montre un graphique de 1965 année à 2015 année Iran, Islamic Rep.. Les données jusqu'à 1964 année ne sont pas présentés. Quantité d'observations actuelles selon dates: 39.
Source (désignation):
Les indicateurs du développement mondiale
Source (organisation):
World Bank staff estimates based data from International Monetary Fund's Direction of Trade database.
Catégories:
Private Sector, Trade
Dernière mise à jour
23 avr. 2017
Les indicateurs de changement de valeurs selon les années
Minimum:
1.579
1 janv. 1969
Maximum:
44.845
1 janv. 2014
Pour la date d''observation
Valeur
Changement absolu
Le changement par rapport à la valeur précédente
1 janv. 1965
2.422
+2.422
0.0%
1 janv. 1966
3.262
+0.84
34.69%
1 janv. 1967
1.971
-1.291
-39.58%
1 janv. 1968
2.171
+0.2
10.16%
1 janv. 1969
1.579
-0.592
-27.25%
1 janv. 1982
5.039
+3.46
219.05%
1 janv. 1983
2.389
-2.65
-52.58%
1 janv. 1984
3.911
+1.522
63.69%
1 janv. 1985
3.346
-0.565
-14.44%
1 janv. 1986
4.164
+0.818
24.43%
1 janv. 1987
7.472
+3.308
79.45%
1 janv. 1988
5.091
-2.381
-31.86%
1 janv. 1989
5.324
+0.232
4.57%
1 janv. 1990
9.916
+4.593
86.27%
1 janv. 1991
5.86
-4.056
-40.91%
1 janv. 1992
5.189
-0.671
-11.46%
1 janv. 1993
5.759
+0.57
10.99%
1 janv. 1994
6.826
+1.067
18.53%
1 janv. 1995
8.034
+1.208
17.7%
1 janv. 1996
4.84
-3.194
-39.76%
1 janv. 1997
5.205
+0.365
7.54%
1 janv. 1998
5.067
-0.138
-2.65%
1 janv. 1999
5.299
+0.232
4.59%
1 janv. 2000
6.063
+0.764
14.42%
1 janv. 2001
9.696
+3.632
59.91%
1 janv. 2002
11.45
+1.755
18.1%
1 janv. 2003
11.543
+0.093
0.81%
1 janv. 2004
15.157
+3.614
31.31%
1 janv. 2005
18.896
+3.739
24.67%
1 janv. 2006
20.333
+1.438
7.61%
1 janv. 2007
24.584
+4.25
20.9%
1 janv. 2008
24.877
+0.293
1.19%
1 janv. 2009
27.352
+2.475
9.95%
1 janv. 2010
27.044
-0.308
-1.13%
1 janv. 2011
35.451
+8.407
31.09%
1 janv. 2012
31.448
-4.002
-11.29%
1 janv. 2013
34.61
+3.162
10.05%
1 janv. 2014
44.845
+10.235
29.57%
1 janv. 2015
39.994
-4.851
-10.82%
Classement des pays selon les statistiques actuelles par années


Commentaires: