29
/fr/
fr
AIzaSyAYiBZKx7MnpbEhh9jyipgxe19OcubqV5w
April 1, 2024
154802
India
IND
true
2
1
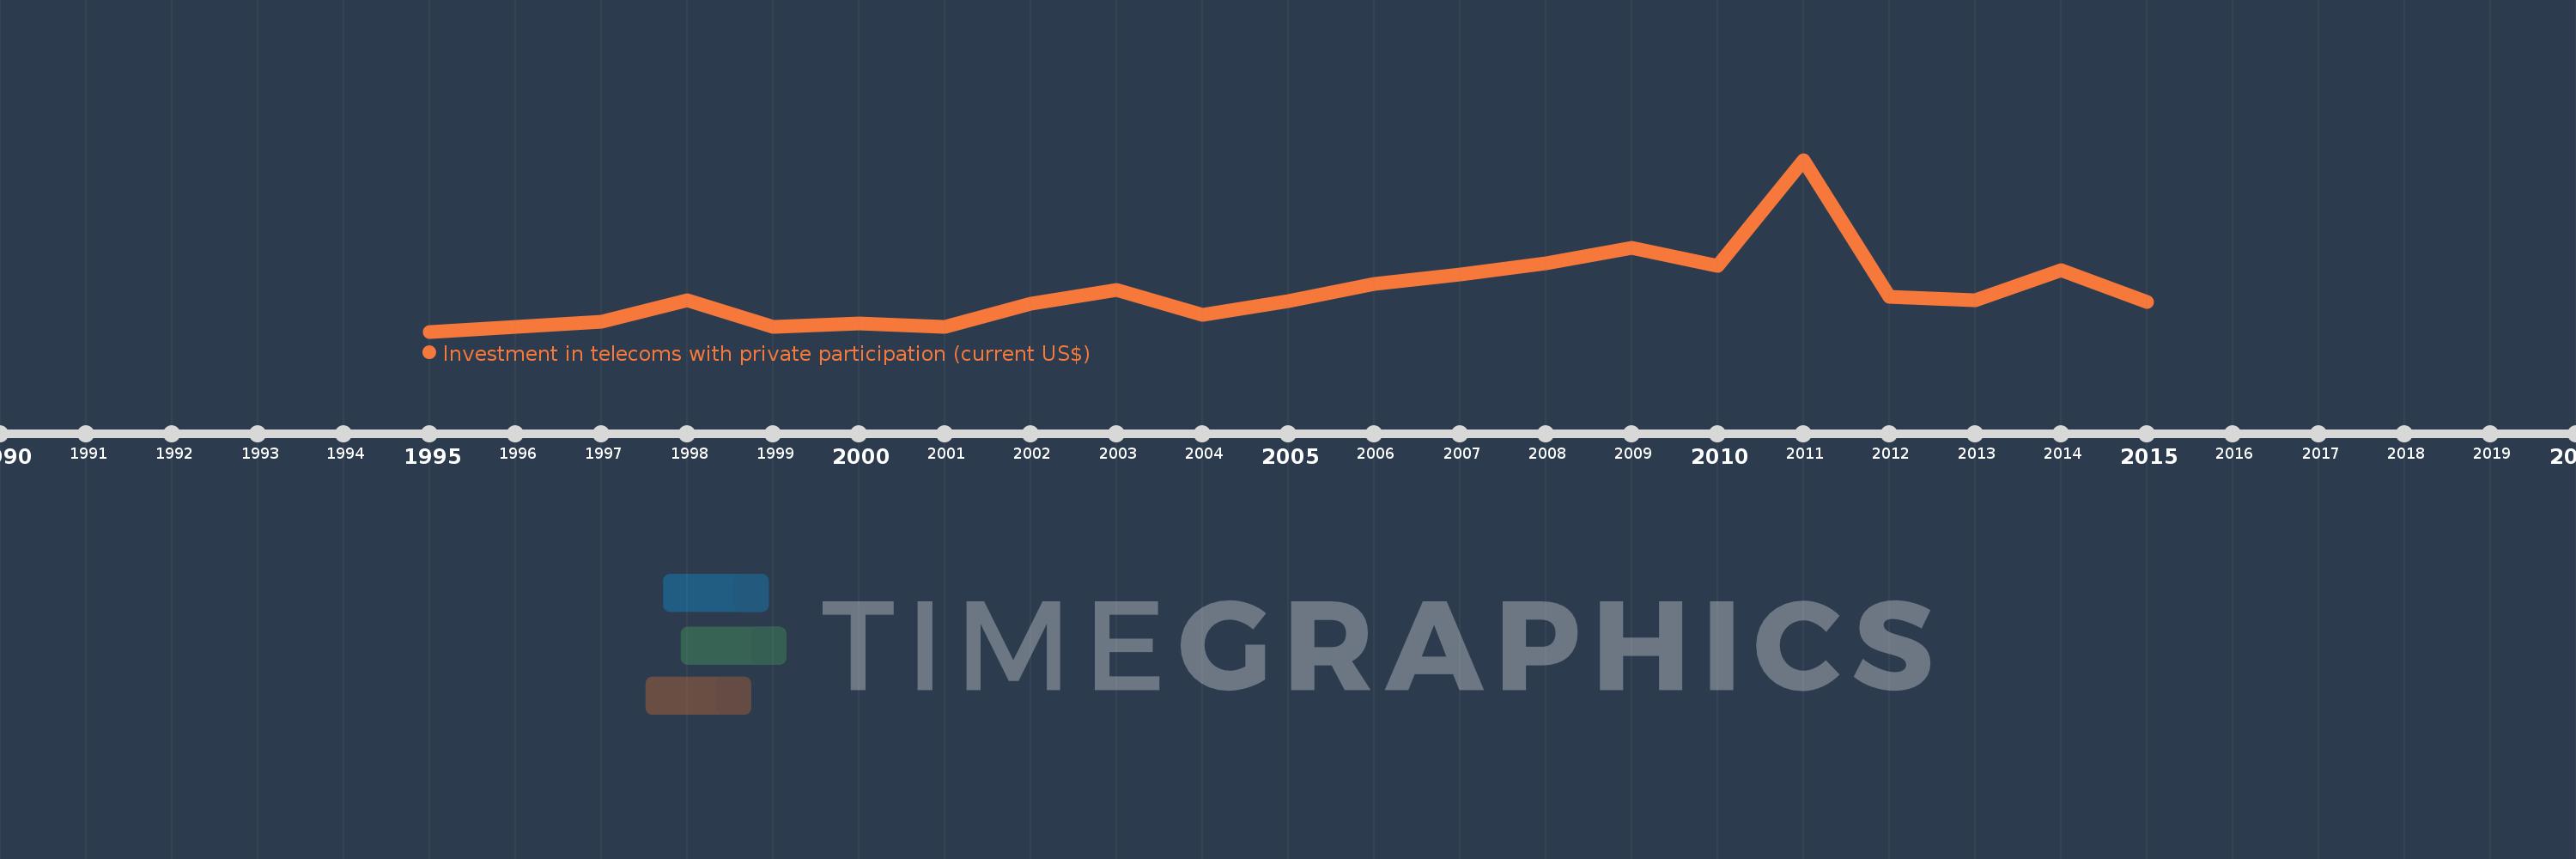
Investment in telecoms with private participation (current US$)
2015,2014,2013,2012,2011,2010,2009,2008,2007,2006,2005,2004,2003,2002,2001,2000,1999,1998,1997,1996,1995
Cette statistique dans les autres pays:
AfghanistanAlbaniaAlgeriaAmerican SamoaAngolaAntigua and BarbudaArgentinaArmeniaAzerbaijanBangladeshBelarusBelizeBeninBhutanBoliviaBosnia and HerzegovinaBotswanaBrazilBulgariaBurkina FasoBurundiCabo VerdeCambodiaCameroonCentral African RepublicChadChileChinaColombiaCongo, Dem. Rep.Congo, Rep.Costa RicaCote d'IvoireCubaDominicaDominican RepublicEarly-demographic dividendEast Asia & Pacific (excluding high income)East Asia & Pacific (IDA & IBRD countries)EcuadorEgypt, Arab Rep.El SalvadorEritreaEthiopiaEurope & Central Asia (excluding high income)Europe & Central Asia (IDA & IBRD countries)FijiFragile and conflict affected situationsGabonGambia, TheGeorgiaGhanaGrenadaGuatemalaGuineaGuinea-BissauGuyanaHaitiHeavily indebted poor countries (HIPC)HondurasIBRD onlyIDA & IBRD totalIDA blendIDA onlyIDA totalIndiaIndonesiaIran, Islamic Rep.IraqJamaicaJordanKazakhstanKenyaKiribatiKorea, Dem. People’s Rep.KosovoKyrgyz RepublicLao PDRLate-demographic dividendLatin America & Caribbean Latin America & Caribbean (excluding high income)Latin America & the Caribbean (IDA & IBRD countries)Least developed countries: UN classificationLebanonLesothoLiberiaLithuaniaLow & middle incomeLow incomeLower middle incomeMacedonia, FYRMadagascarMalawiMalaysiaMaldivesMaliMauritaniaMauritiusMexicoMicronesia, Fed. Sts.Middle East & North Africa (excluding high income)Middle East & North Africa (IDA & IBRD countries)Middle incomeMoldovaMongoliaMontenegroMoroccoMozambiqueMyanmarNamibiaNepalNicaraguaNigerNigeriaOther small statesPacific island small statesPakistanPanamaPapua New GuineaParaguayPeruPhilippinesPre-demographic dividendRomaniaRussian FederationRwandaSamoaSenegalSerbiaSeychellesSierra LeoneSomaliaSouth AfricaSouth AsiaSouth Asia (IDA & IBRD)South SudanSri LankaSt. Kitts and NevisSt. LuciaSt. Vincent and the GrenadinesSub-Saharan Africa Sub-Saharan Africa (excluding high income)Sub-Saharan Africa (IDA & IBRD countries)SudanSurinameSwazilandSyrian Arab RepublicTajikistanTanzaniaThailandTimor-LesteTogoTongaTunisiaTurkeyTurkmenistanUgandaUkraineUpper middle incomeUruguayUzbekistanVanuatuVenezuela, RBVietnamWest Bank and GazaYemen, Rep.ZambiaZimbabwe La ligne de temps
Cette échelle de temps montre un graphique de 1995 année à 2015 année India. Les données jusqu'à 1994 année ne sont pas présentés. Quantité d'observations actuelles selon dates: 21.
Source (désignation):
Les indicateurs du développement mondiale
Source (organisation):
World Bank, Private Participation in Infrastructure Project Database (http://ppi.worldbank.org).
Catégories:
Infrastructure, Private Sector
Dernière mise à jour
23 avr. 2017
Les indicateurs de changement de valeurs selon les années
Minimum:
96.7 mln.
1 janv. 1995
Maximum:
20.335 mds
1 janv. 2011
Pour la date d''observation
Valeur
Changement absolu
Le changement par rapport à la valeur précédente
1 janv. 1995
96.7 mln.
+96.7 mln.
0.0%
1 janv. 1996
682.8 mln.
+586.1 mln.
606.1%
1 janv. 1997
1.229 mds
+545.9 mln.
79.95%
1 janv. 1998
3.827 mds
+2.598 mds
211.47%
1 janv. 1999
672.9 mln.
-3.154 mds
-82.42%
1 janv. 2000
1.045 mds
+372.5 mln.
55.36%
1 janv. 2001
681.6 mln.
-363.8 mln.
-34.8%
1 janv. 2002
3.415 mds
+2.733 mds
401.04%
1 janv. 2003
5.008 mds
+1.593 mds
46.65%
1 janv. 2004
2.08 mds
-2.929 mds
-58.48%
1 janv. 2005
3.701 mds
+1.622 mds
77.97%
1 janv. 2006
5.666 mds
+1.965 mds
53.08%
1 janv. 2007
6.823 mds
+1.157 mds
20.43%
1 janv. 2008
8.168 mds
+1.345 mds
19.71%
1 janv. 2009
9.934 mds
+1.766 mds
21.61%
1 janv. 2010
7.83 mds
-2.104 mds
-21.18%
1 janv. 2011
20.335 mds
+12.505 mds
159.72%
1 janv. 2012
4.242 mds
-16.093 mds
-79.14%
1 janv. 2013
3.817 mds
-425.0 mln.
-10.02%
1 janv. 2014
7.358 mds
+3.541 mds
92.76%
1 janv. 2015
3.617 mds
-3.741 mds
-50.84%
Classement des pays selon les statistiques actuelles par années


Commentaires: