29
/fr/
fr
AIzaSyAYiBZKx7MnpbEhh9jyipgxe19OcubqV5w
April 1, 2024
153891
Iceland
ISL
true
2
1
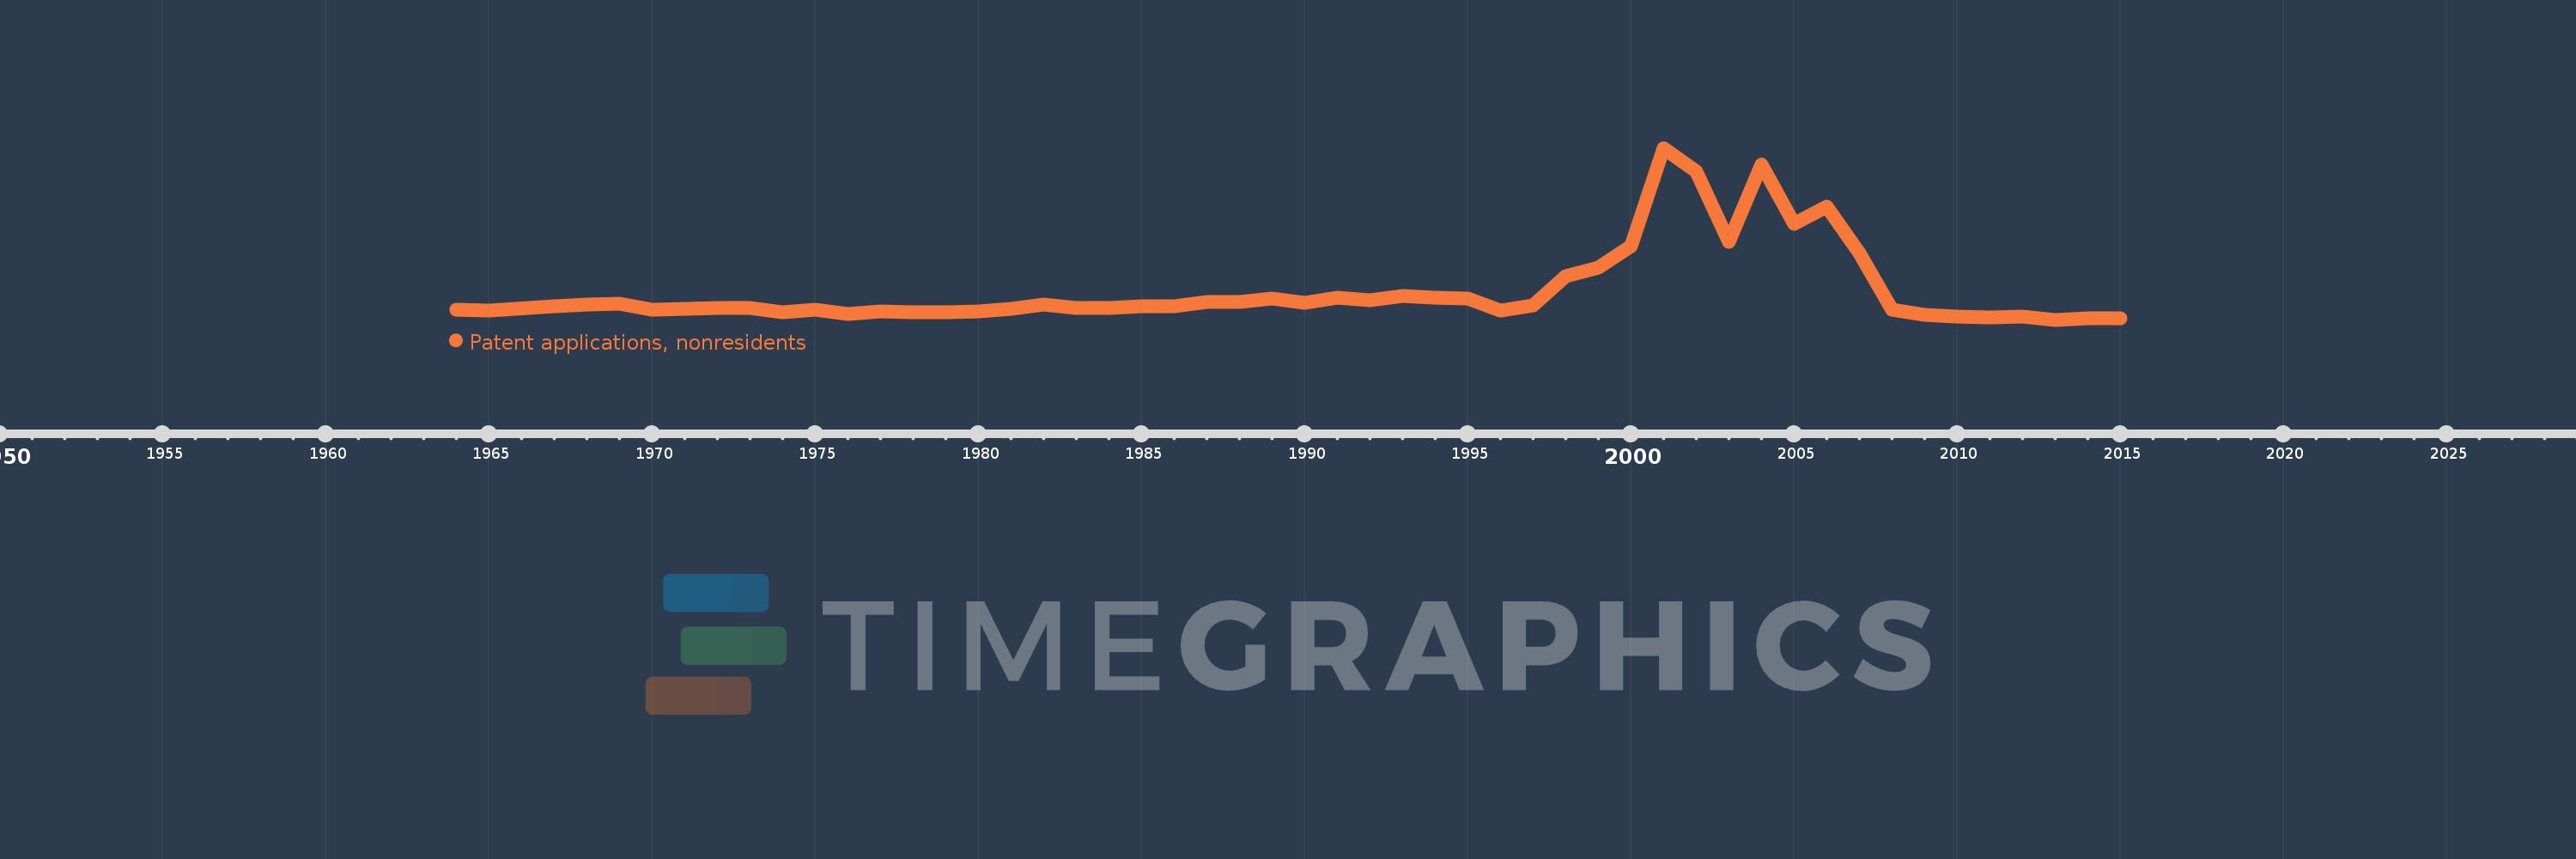
Patent applications, nonresidents
2015,2014,2013,2012,2011,2010,2009,2008,2007,2006,2005,2004,2003,2002,2001,2000,1999,1998,1997,1996,1995,1994,1993,1992,1991,1990,1989,1988,1987,1986,1985,1984,1983,1982,1981,1980,1979,1978,1977,1976,1975,1974,1973,1972,1971,1970,1969,1968,1967,1965,1964
Cette statistique dans les autres pays:
AlbaniaAlgeriaAngolaAntigua and BarbudaArab WorldArgentinaArmeniaAustraliaAustriaAzerbaijanBahamas, TheBahrainBangladeshBarbadosBelarusBelgiumBelizeBhutanBoliviaBosnia and HerzegovinaBotswanaBrazilBrunei DarussalamBulgariaBurundiCambodiaCanadaCaribbean small statesCentral Europe and the BalticsChileChinaColombiaCongo, Dem. Rep.Congo, Rep.Costa RicaCote d'IvoireCroatiaCubaCyprusCzech RepublicDenmarkDjiboutiDominicaDominican RepublicEarly-demographic dividendEast Asia & PacificEast Asia & Pacific (excluding high income)East Asia & Pacific (IDA & IBRD countries)EcuadorEgypt, Arab Rep.El SalvadorEstoniaEthiopiaEuro areaEurope & Central AsiaEurope & Central Asia (excluding high income)Europe & Central Asia (IDA & IBRD countries)European UnionFijiFinlandFranceGambia, TheGeorgiaGermanyGhanaGreeceGrenadaGuatemalaGuyanaHaitiHigh incomeHondurasHong Kong SAR, ChinaHungaryIBRD onlyIcelandIDA & IBRD totalIDA blendIndiaIndonesiaIran, Islamic Rep.IraqIrelandIsraelItalyJamaicaJapanJordanKazakhstanKenyaKiribatiKorea, Dem. People’s Rep.Korea, Rep.KuwaitKyrgyz RepublicLao PDRLate-demographic dividendLatin America & Caribbean Latin America & Caribbean (excluding high income)Latin America & the Caribbean (IDA & IBRD countries)LatviaLebanonLesothoLiberiaLibyaLithuaniaLow & middle incomeLower middle incomeLuxembourgMacao SAR, ChinaMacedonia, FYRMadagascarMalawiMalaysiaMaliMaltaMauritiusMexicoMiddle East & North AfricaMiddle East & North Africa (excluding high income)Middle East & North Africa (IDA & IBRD countries)Middle incomeMoldovaMonacoMongoliaMontenegroMoroccoMozambiqueNamibiaNepalNetherlandsNew ZealandNicaraguaNigeriaNorth AmericaNorwayOECD membersPacific island small statesPakistanPanamaPapua New GuineaParaguayPeruPhilippinesPolandPortugalPost-demographic dividendQatarRomaniaRussian FederationRwandaSamoaSao Tome and PrincipeSaudi ArabiaSerbiaSeychellesSierra LeoneSingaporeSlovak RepublicSloveniaSolomon IslandsSomaliaSouth AfricaSouth AsiaSouth Asia (IDA & IBRD)SpainSri LankaSt. LuciaSt. Vincent and the GrenadinesSudanSwazilandSwedenSwitzerlandSyrian Arab RepublicTajikistanTanzaniaThailandTrinidad and TobagoTunisiaTurkeyTurkmenistanUgandaUkraineUnited Arab EmiratesUnited KingdomUnited StatesUpper middle incomeUruguayUzbekistanVenezuela, RBVietnamWorldYemen, Rep.ZambiaZimbabwe La ligne de temps
Cette échelle de temps montre un graphique de 1964 année à 2015 année Iceland. Les données jusqu'à 1963 année ne sont pas présentés. Quantité d'observations actuelles selon dates: 51.
Source (désignation):
Les indicateurs du développement mondiale
Source (organisation):
World Intellectual Property Organization (WIPO), WIPO Patent Report: Statistics on Worldwide Patent Activity. The International Bureau of WIPO assumes no responsibility with respect to the transformation of these data.
Catégories:
Science & Technology
Dernière mise à jour
23 avr. 2017
Les indicateurs de changement de valeurs selon les années
Maximum:
825.0
1 janv. 2001
Pour la date d''observation
Valeur
Changement absolu
Le changement par rapport à la valeur précédente
1 janv. 1964
53.0
+53.0
0.0%
1 janv. 1965
52.0
-1.0
-1.89%
1 janv. 1967
71.0
+19.0
36.54%
1 janv. 1968
78.0
+7.0
9.86%
1 janv. 1969
82.0
+4.0
5.13%
1 janv. 1970
56.0
-26.0
-31.71%
1 janv. 1971
59.0
+3.0
5.36%
1 janv. 1972
65.0
+6.0
10.17%
1 janv. 1973
64.0
-1.0
-1.54%
1 janv. 1974
43.0
-21.0
-32.81%
1 janv. 1975
55.0
+12.0
27.91%
1 janv. 1976
34.0
-21.0
-38.18%
1 janv. 1977
48.0
+14.0
41.18%
1 janv. 1978
41.0
-7.0
-14.58%
1 janv. 1979
43.0
+2.0
4.88%
1 janv. 1980
45.0
+2.0
4.65%
1 janv. 1981
58.0
+13.0
28.89%
1 janv. 1982
79.0
+21.0
36.21%
1 janv. 1983
62.0
-17.0
-21.52%
1 janv. 1984
62.0
0.0
0.0%
1 janv. 1985
70.0
+8.0
12.9%
1 janv. 1986
71.0
+1.0
1.43%
1 janv. 1987
92.0
+21.0
29.58%
1 janv. 1988
91.0
-1.0
-1.09%
1 janv. 1989
110.0
+19.0
20.88%
1 janv. 1990
87.0
-23.0
-20.91%
1 janv. 1991
113.0
+26.0
29.89%
1 janv. 1992
99.0
-14.0
-12.39%
1 janv. 1993
121.0
+22.0
22.22%
1 janv. 1994
112.0
-9.0
-7.44%
1 janv. 1995
108.0
-4.0
-3.57%
1 janv. 1996
49.0
-59.0
-54.63%
1 janv. 1997
75.0
+26.0
53.06%
1 janv. 1998
216.0
+141.0
188.0%
1 janv. 1999
254.0
+38.0
17.59%
1 janv. 2000
357.0
+103.0
40.55%
1 janv. 2001
825.0
+468.0
131.09%
1 janv. 2002
713.0
-112.0
-13.58%
1 janv. 2003
379.0
-334.0
-46.84%
1 janv. 2004
748.0
+369.0
97.36%
1 janv. 2005
463.0
-285.0
-38.1%
1 janv. 2006
545.0
+82.0
17.71%
1 janv. 2007
326.0
-219.0
-40.18%
1 janv. 2008
53.0
-273.0
-83.74%
1 janv. 2009
31.0
-22.0
-41.51%
1 janv. 2010
22.0
-9.0
-29.03%
1 janv. 2011
19.0
-3.0
-13.64%
1 janv. 2012
21.0
+2.0
10.53%
1 janv. 2013
7.0
-14.0
-66.67%
1 janv. 2014
13.0
+6.0
85.71%
1 janv. 2015
13.0
0.0
0.0%
Classement des pays selon les statistiques actuelles par années


Commentaires: