29
/fr/
fr
AIzaSyAYiBZKx7MnpbEhh9jyipgxe19OcubqV5w
April 1, 2024
153859
Iceland
ISL
true
2
1
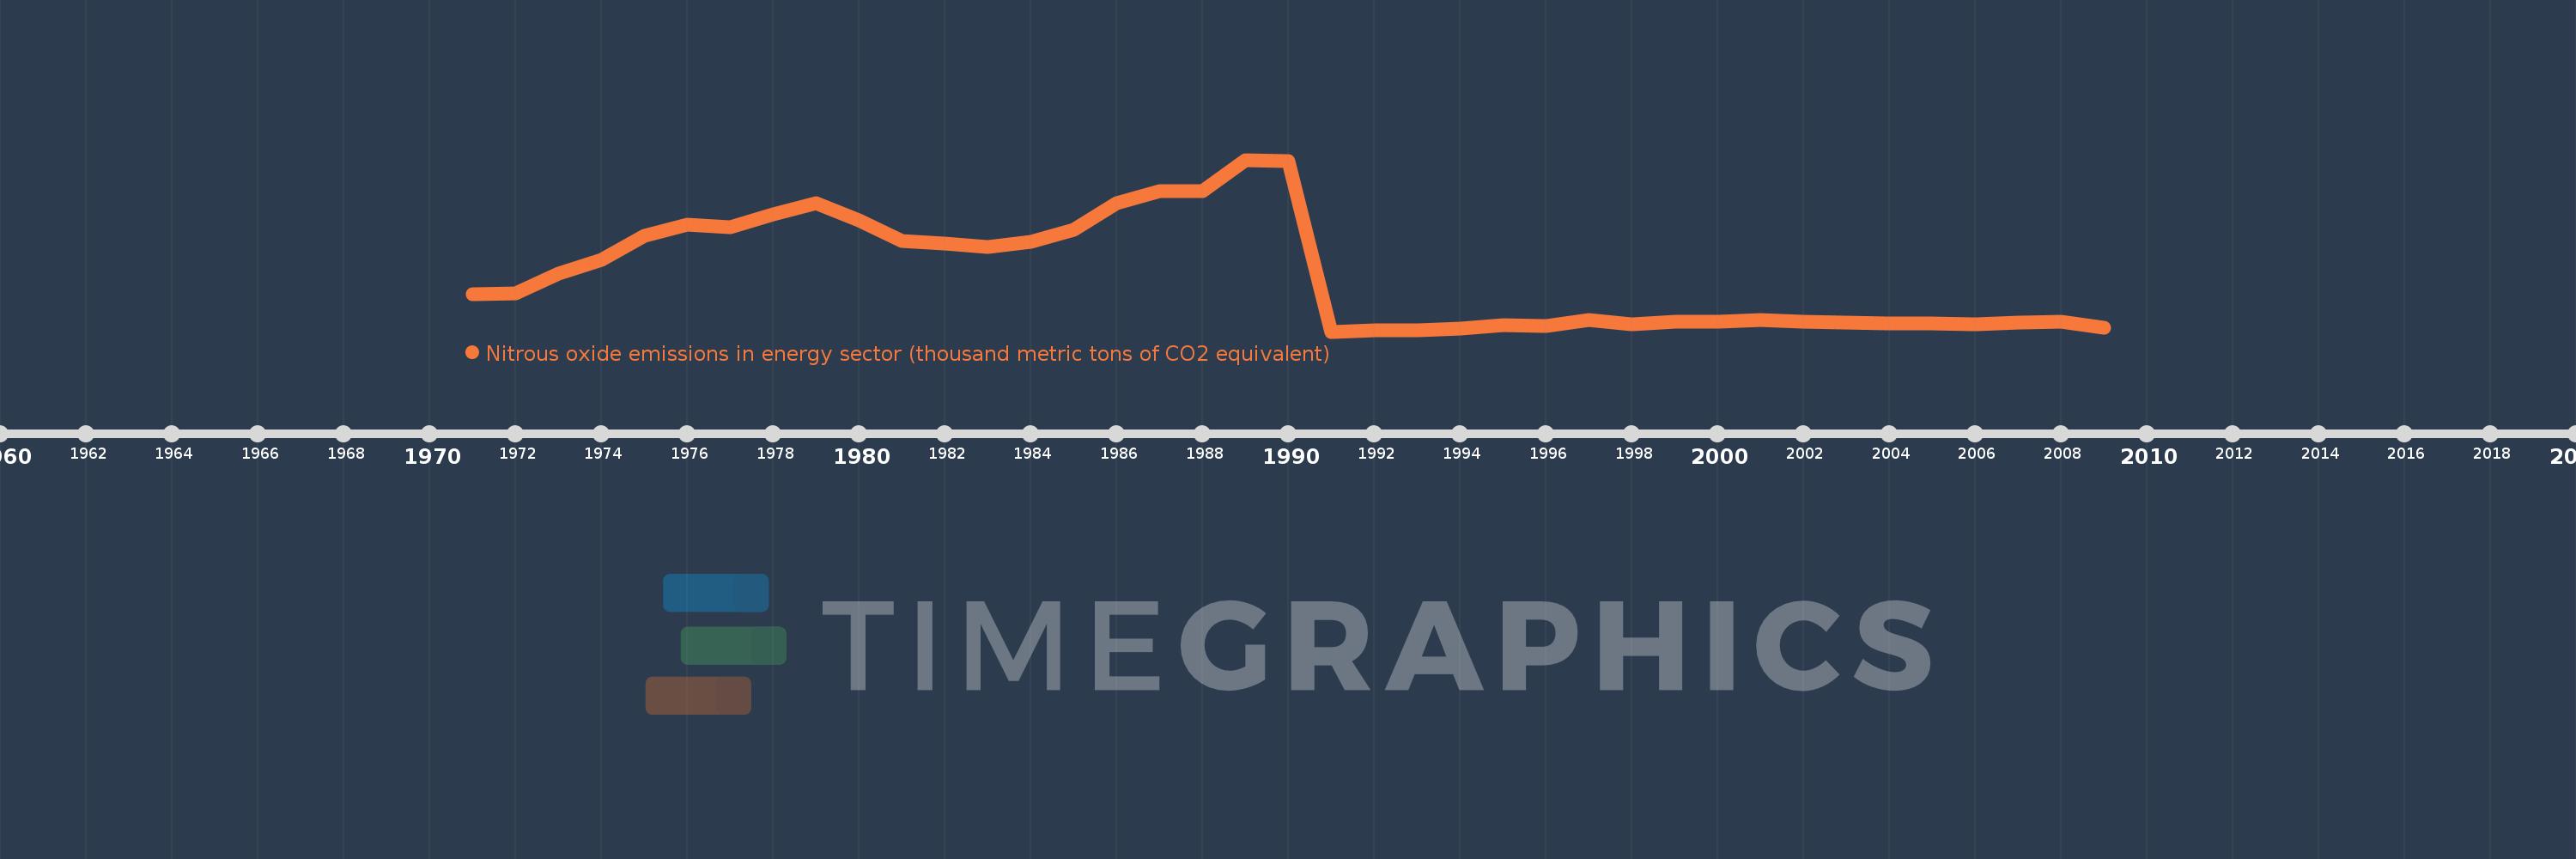
Nitrous oxide emissions in energy sector (thousand metric tons of CO2 equivalent)
2009,2008,2007,2006,2005,2004,2003,2002,2001,2000,1999,1998,1997,1996,1995,1994,1993,1992,1991,1990,1989,1988,1987,1986,1985,1984,1983,1982,1981,1980,1979,1978,1977,1976,1975,1974,1973,1972,1971
Cette statistique dans les autres pays:
AfghanistanAlbaniaAlgeriaAmerican SamoaAndorraAngolaAntigua and BarbudaArab WorldArgentinaArmeniaArubaAustraliaAustriaAzerbaijanBahamas, TheBahrainBangladeshBarbadosBelarusBelgiumBelizeBeninBermudaBhutanBoliviaBosnia and HerzegovinaBotswanaBrazilBritish Virgin IslandsBrunei DarussalamBulgariaBurkina FasoBurundiCabo VerdeCambodiaCameroonCanadaCaribbean small statesCayman IslandsCentral African RepublicCentral Europe and the BalticsChadChannel IslandsChileChinaColombiaComorosCongo, Dem. Rep.Congo, Rep.Costa RicaCote d'IvoireCroatiaCubaCuracaoCyprusCzech RepublicDenmarkDjiboutiDominicaDominican RepublicEarly-demographic dividendEast Asia & PacificEast Asia & Pacific (excluding high income)East Asia & Pacific (IDA & IBRD countries)EcuadorEgypt, Arab Rep.El SalvadorEquatorial GuineaEritreaEstoniaEthiopiaEuro areaEurope & Central AsiaEurope & Central Asia (excluding high income)Europe & Central Asia (IDA & IBRD countries)European UnionFaroe IslandsFijiFinlandFragile and conflict affected situationsFranceFrench PolynesiaGabonGambia, TheGeorgiaGermanyGhanaGibraltarGreeceGreenlandGrenadaGuamGuatemalaGuineaGuinea-BissauGuyanaHaitiHeavily indebted poor countries (HIPC)High incomeHondurasHong Kong SAR, ChinaHungaryIBRD onlyIcelandIDA & IBRD totalIDA blendIDA onlyIDA totalIndiaIndonesiaIran, Islamic Rep.IraqIrelandIsle of ManIsraelItalyJamaicaJapanJordanKazakhstanKenyaKiribatiKorea, Dem. People’s Rep.Korea, Rep.KosovoKuwaitKyrgyz RepublicLao PDRLate-demographic dividendLatin America & Caribbean Latin America & Caribbean (excluding high income)Latin America & the Caribbean (IDA & IBRD countries)LatviaLeast developed countries: UN classificationLebanonLesothoLiberiaLibyaLiechtensteinLithuaniaLow & middle incomeLow incomeLower middle incomeLuxembourgMacao SAR, ChinaMacedonia, FYRMadagascarMalawiMalaysiaMaldivesMaliMaltaMarshall IslandsMauritaniaMauritiusMexicoMicronesia, Fed. Sts.Middle East & North AfricaMiddle East & North Africa (excluding high income)Middle East & North Africa (IDA & IBRD countries)Middle incomeMoldovaMonacoMongoliaMontenegroMoroccoMozambiqueMyanmarNamibiaNauruNepalNetherlandsNew CaledoniaNew ZealandNicaraguaNigerNigeriaNorth AmericaNorthern Mariana IslandsNorwayOECD membersOmanOther small statesPacific island small statesPakistanPalauPanamaPapua New GuineaParaguayPeruPhilippinesPolandPortugalPost-demographic dividendPre-demographic dividendPuerto RicoQatarRomaniaRussian FederationRwandaSamoaSan MarinoSao Tome and PrincipeSaudi ArabiaSenegalSerbiaSeychellesSierra LeoneSingaporeSint Maarten (Dutch part)Slovak RepublicSloveniaSmall statesSolomon IslandsSomaliaSouth AfricaSouth AsiaSouth Asia (IDA & IBRD)South SudanSpainSri LankaSt. Kitts and NevisSt. LuciaSt. Martin (French part)St. Vincent and the GrenadinesSub-Saharan Africa Sub-Saharan Africa (excluding high income)Sub-Saharan Africa (IDA & IBRD countries)SudanSurinameSwazilandSwedenSwitzerlandSyrian Arab RepublicTajikistanTanzaniaThailandTimor-LesteTogoTongaTrinidad and TobagoTunisiaTurkeyTurkmenistanTurks and Caicos IslandsTuvaluUgandaUkraineUnited Arab EmiratesUnited KingdomUnited StatesUpper middle incomeUruguayUzbekistanVanuatuVenezuela, RBVietnamVirgin Islands (U.S.)West Bank and GazaWorldYemen, Rep.ZambiaZimbabwe La ligne de temps
Cette échelle de temps montre un graphique de 1971 année à 2009 année Iceland. Les données jusqu'à 1970 année ne sont pas présentés. Quantité d'observations actuelles selon dates: 39.
Source (désignation):
Les indicateurs du développement mondiale
Source (organisation):
European Commission, Joint Research Centre (JRC)/Netherlands Environmental Assessment Agency (PBL). Emission Database for Global Atmospheric Research (EDGAR): http://edgar.jrc.ec.europa.eu/
Catégories:
Energy & Mining, Environment
Dernière mise à jour
23 avr. 2017
Les indicateurs de changement de valeurs selon les années
Minimum:
13.691
1 janv. 1991
Maximum:
77.013
1 janv. 1989
Pour la date d''observation
Valeur
Changement absolu
Le changement par rapport à la valeur précédente
1 janv. 1971
27.326
+27.326
0.0%
1 janv. 1972
27.72
+0.394
1.44%
1 janv. 1973
35.055
+7.335
26.46%
1 janv. 1974
40.151
+5.096
14.54%
1 janv. 1975
48.884
+8.732
21.75%
1 janv. 1976
53.267
+4.384
8.97%
1 janv. 1977
52.116
-1.151
-2.16%
1 janv. 1978
56.951
+4.835
9.28%
1 janv. 1979
61.061
+4.11
7.22%
1 janv. 1980
54.647
-6.414
-10.5%
1 janv. 1981
47.025
-7.622
-13.95%
1 janv. 1982
46.247
-0.778
-1.65%
1 janv. 1983
44.746
-1.501
-3.25%
1 janv. 1984
46.664
+1.919
4.29%
1 janv. 1985
51.35
+4.685
10.04%
1 janv. 1986
60.902
+9.552
18.6%
1 janv. 1987
65.404
+4.502
7.39%
1 janv. 1988
65.404
0.0
0.0%
1 janv. 1989
77.013
+11.608
17.75%
1 janv. 1990
76.633
-0.38
-0.49%
1 janv. 1991
13.691
-62.942
-82.13%
1 janv. 1992
14.3
+0.609
4.45%
1 janv. 1993
14.292
-0.008
-0.06%
1 janv. 1994
14.836
+0.544
3.81%
1 janv. 1995
15.99
+1.154
7.78%
1 janv. 1996
15.713
-0.277
-1.73%
1 janv. 1997
18.122
+2.409
15.33%
1 janv. 1998
16.516
-1.605
-8.86%
1 janv. 1999
17.19
+0.674
4.08%
1 janv. 2000
17.302
+0.112
0.65%
1 janv. 2001
17.926
+0.624
3.6%
1 janv. 2002
17.471
-0.455
-2.54%
1 janv. 2003
17.138
-0.333
-1.91%
1 janv. 2004
16.749
-0.388
-2.27%
1 janv. 2005
16.851
+0.101
0.61%
1 janv. 2006
16.364
-0.487
-2.89%
1 janv. 2007
17.017
+0.653
3.99%
1 janv. 2008
17.431
+0.414
2.43%
1 janv. 2009
15.082
-2.348
-13.47%
Classement des pays selon les statistiques actuelles par années


Commentaires: