29
/fr/
fr
AIzaSyAYiBZKx7MnpbEhh9jyipgxe19OcubqV5w
April 1, 2024
152507
Hungary
HUN
true
2
1
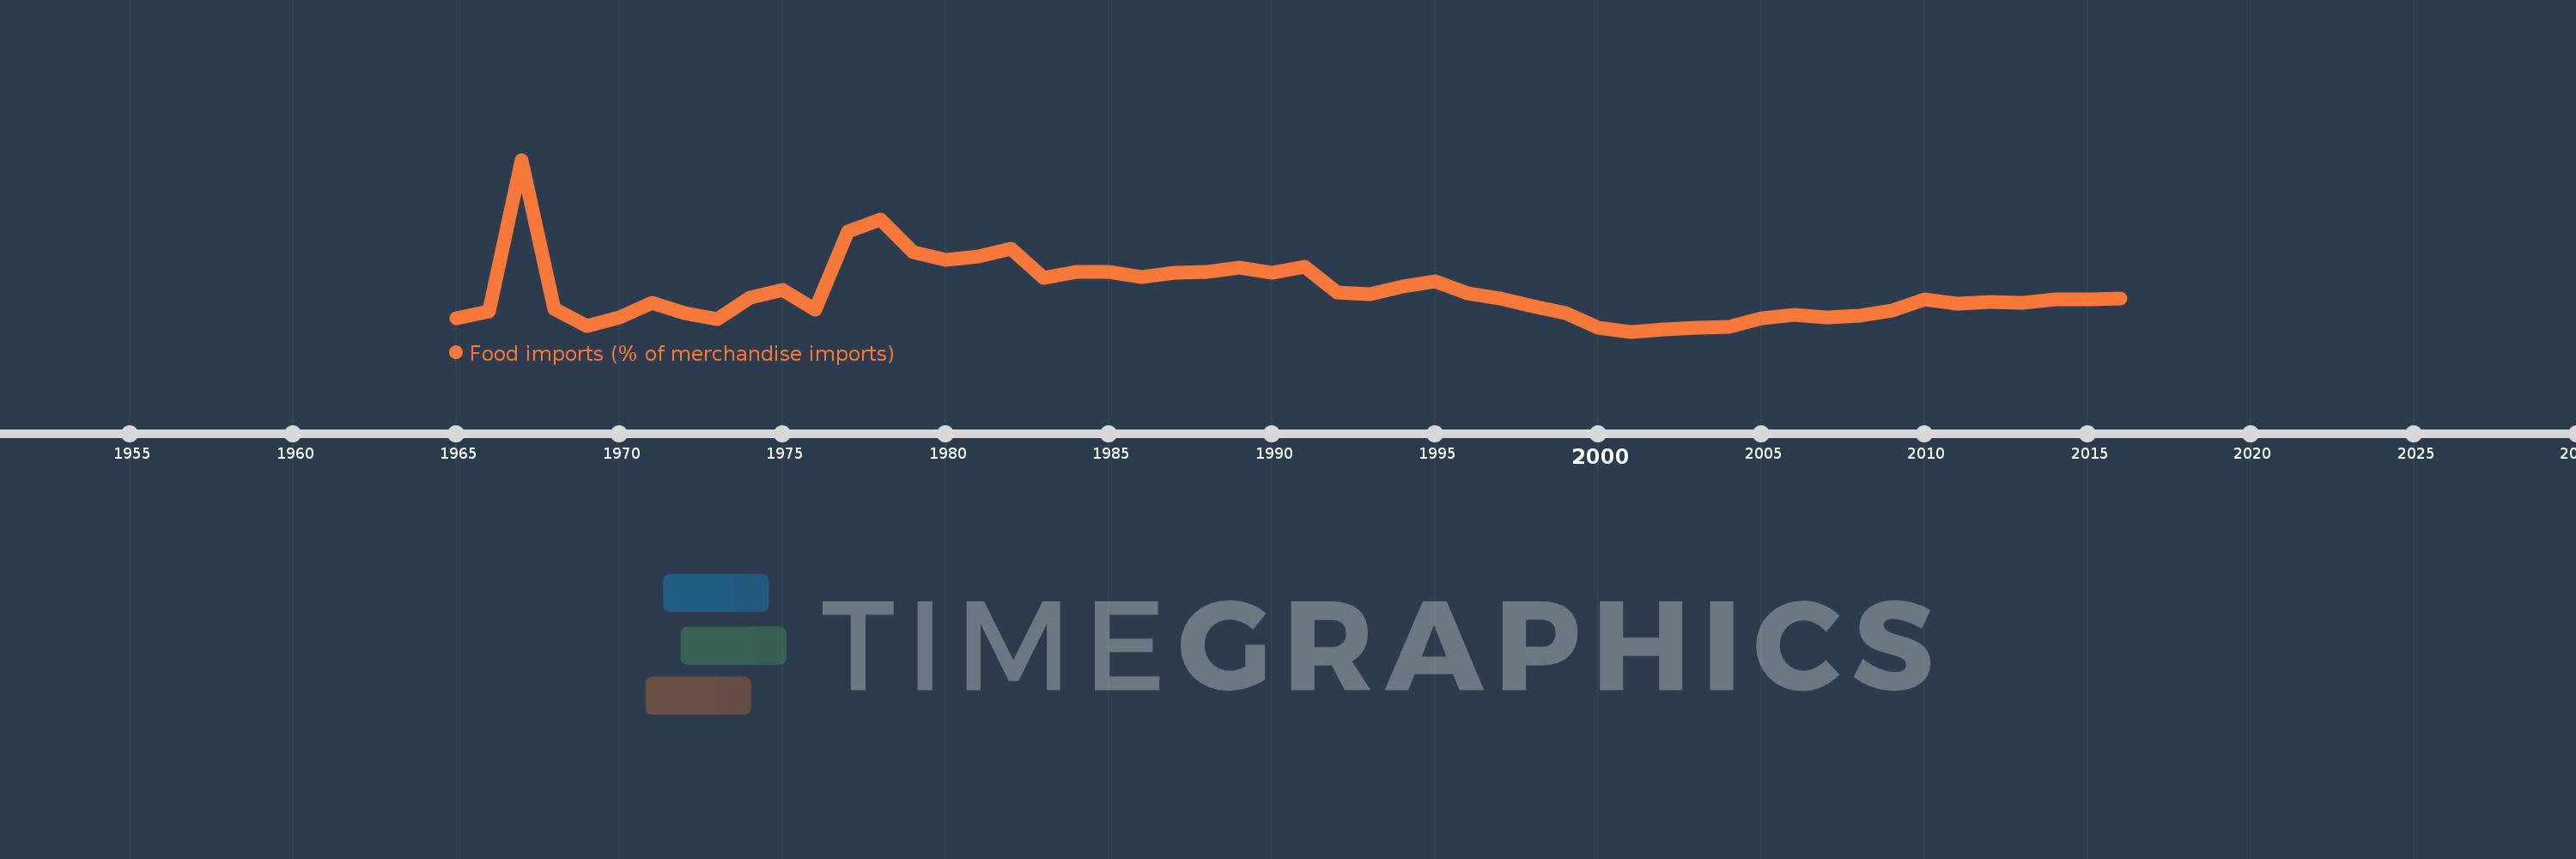
Food imports (% of merchandise imports)
2016,2015,2014,2013,2012,2011,2010,2009,2008,2007,2006,2005,2004,2003,2002,2001,2000,1999,1998,1997,1996,1995,1994,1993,1992,1991,1990,1989,1988,1987,1986,1985,1984,1983,1982,1981,1980,1979,1978,1977,1976,1975,1974,1973,1972,1971,1970,1969,1968,1967,1966,1965
Cette statistique dans les autres pays:
AfghanistanAlbaniaAlgeriaAndorraAngolaAntigua and BarbudaArab WorldArgentinaArmeniaArubaAustraliaAustriaAzerbaijanBahamas, TheBahrainBangladeshBarbadosBelarusBelgiumBelizeBeninBermudaBhutanBoliviaBosnia and HerzegovinaBotswanaBrazilBrunei DarussalamBulgariaBurkina FasoBurundiCabo VerdeCambodiaCameroonCanadaCaribbean small statesCayman IslandsCentral African RepublicCentral Europe and the BalticsChadChileChinaColombiaComorosCongo, Dem. Rep.Congo, Rep.Costa RicaCote d'IvoireCroatiaCubaCyprusCzech RepublicDenmarkDjiboutiDominicaDominican RepublicEarly-demographic dividendEast Asia & PacificEast Asia & Pacific (excluding high income)East Asia & Pacific (IDA & IBRD countries)EcuadorEgypt, Arab Rep.El SalvadorEquatorial GuineaEritreaEstoniaEthiopiaEuro areaEurope & Central AsiaEurope & Central Asia (excluding high income)Europe & Central Asia (IDA & IBRD countries)European UnionFaroe IslandsFijiFinlandFragile and conflict affected situationsFranceFrench PolynesiaGabonGambia, TheGeorgiaGermanyGhanaGreeceGreenlandGrenadaGuatemalaGuineaGuinea-BissauGuyanaHaitiHeavily indebted poor countries (HIPC)High incomeHondurasHong Kong SAR, ChinaHungaryIBRD onlyIcelandIDA & IBRD totalIDA blendIDA onlyIDA totalIndiaIndonesiaIran, Islamic Rep.IraqIrelandIsraelItalyJamaicaJapanJordanKazakhstanKenyaKiribatiKorea, Rep.KuwaitKyrgyz RepublicLao PDRLate-demographic dividendLatin America & Caribbean Latin America & Caribbean (excluding high income)Latin America & the Caribbean (IDA & IBRD countries)LatviaLeast developed countries: UN classificationLebanonLesothoLiberiaLibyaLithuaniaLow & middle incomeLow incomeLower middle incomeLuxembourgMacao SAR, ChinaMacedonia, FYRMadagascarMalawiMalaysiaMaldivesMaliMaltaMauritaniaMauritiusMexicoMiddle East & North AfricaMiddle East & North Africa (excluding high income)Middle East & North Africa (IDA & IBRD countries)Middle incomeMoldovaMongoliaMoroccoMozambiqueMyanmarNamibiaNepalNetherlandsNew CaledoniaNew ZealandNicaraguaNigerNigeriaNorth AmericaNorwayOECD membersOmanOther small statesPacific island small statesPakistanPalauPanamaPapua New GuineaParaguayPeruPhilippinesPolandPortugalPost-demographic dividendPre-demographic dividendQatarRomaniaRussian FederationRwandaSamoaSao Tome and PrincipeSaudi ArabiaSenegalSerbiaSeychellesSierra LeoneSingaporeSlovak RepublicSloveniaSmall statesSolomon IslandsSomaliaSouth AfricaSouth AsiaSouth Asia (IDA & IBRD)SpainSri LankaSt. Kitts and NevisSt. LuciaSt. Vincent and the GrenadinesSub-Saharan Africa Sub-Saharan Africa (excluding high income)Sub-Saharan Africa (IDA & IBRD countries)SudanSurinameSwazilandSwedenSwitzerlandSyrian Arab RepublicTajikistanTanzaniaThailandTimor-LesteTogoTongaTrinidad and TobagoTunisiaTurkeyTurkmenistanTurks and Caicos IslandsTuvaluUgandaUkraineUnited Arab EmiratesUnited KingdomUnited StatesUpper middle incomeUruguayVanuatuVenezuela, RBVietnamVirgin Islands (U.S.)WorldYemen, Rep.ZambiaZimbabwe La ligne de temps
Cette échelle de temps montre un graphique de 1965 année à 2016 année Hungary. Les données jusqu'à 1964 année ne sont pas présentés. Quantité d'observations actuelles selon dates: 52.
Source (désignation):
Les indicateurs du développement mondiale
Source (organisation):
World Bank staff estimates from the Comtrade database maintained by the United Nations Statistics Division.
Catégories:
Private Sector, Trade
Dernière mise à jour
23 avr. 2017
Les indicateurs de changement de valeurs selon les années
Maximum:
15.27
1 janv. 1967
Pour la date d''observation
Valeur
Changement absolu
Le changement par rapport à la valeur précédente
1 janv. 1965
3.85
+3.85
0.0%
1 janv. 1966
4.339
+0.489
12.7%
1 janv. 1967
15.27
+10.932
251.97%
1 janv. 1968
4.543
-10.727
-70.25%
1 janv. 1969
3.297
-1.246
-27.43%
1 janv. 1970
3.927
+0.63
19.11%
1 janv. 1971
4.967
+1.041
26.5%
1 janv. 1972
4.228
-0.739
-14.88%
1 janv. 1973
3.783
-0.445
-10.53%
1 janv. 1974
5.345
+1.563
41.31%
1 janv. 1975
5.922
+0.577
10.79%
1 janv. 1976
4.48
-1.442
-24.35%
1 janv. 1977
10.098
+5.617
125.38%
1 janv. 1978
11.003
+0.905
8.96%
1 janv. 1979
8.653
-2.349
-21.35%
1 janv. 1980
8.069
-0.585
-6.76%
1 janv. 1981
8.304
+0.235
2.91%
1 janv. 1982
8.903
+0.599
7.21%
1 janv. 1983
6.766
-2.137
-24.0%
1 janv. 1984
7.203
+0.437
6.46%
1 janv. 1985
7.208
+0.005
0.07%
1 janv. 1986
6.855
-0.353
-4.9%
1 janv. 1987
7.146
+0.291
4.25%
1 janv. 1988
7.188
+0.042
0.59%
1 janv. 1989
7.529
+0.341
4.74%
1 janv. 1990
7.13
-0.399
-5.3%
1 janv. 1991
7.558
+0.428
6.0%
1 janv. 1992
5.739
-1.819
-24.06%
1 janv. 1993
5.619
-0.12
-2.09%
1 janv. 1994
6.148
+0.529
9.42%
1 janv. 1995
6.535
+0.386
6.28%
1 janv. 1996
5.663
-0.871
-13.33%
1 janv. 1997
5.295
-0.368
-6.5%
1 janv. 1998
4.708
-0.587
-11.09%
1 janv. 1999
4.247
-0.461
-9.8%
1 janv. 2000
3.214
-1.033
-24.33%
1 janv. 2001
2.91
-0.304
-9.46%
1 janv. 2002
3.084
+0.175
6.01%
1 janv. 2003
3.204
+0.12
3.88%
1 janv. 2004
3.276
+0.072
2.26%
1 janv. 2005
3.861
+0.585
17.86%
1 janv. 2006
4.103
+0.241
6.25%
1 janv. 2007
3.929
-0.173
-4.22%
1 janv. 2008
4.066
+0.137
3.48%
1 janv. 2009
4.43
+0.364
8.95%
1 janv. 2010
5.255
+0.825
18.62%
1 janv. 2011
4.89
-0.364
-6.93%
1 janv. 2012
5.051
+0.161
3.29%
1 janv. 2013
4.953
-0.098
-1.94%
1 janv. 2014
5.216
+0.263
5.31%
1 janv. 2015
5.219
+0.003
0.06%
1 janv. 2016
5.271
+0.052
1.0%
Classement des pays selon les statistiques actuelles par années


Commentaires: