29
/fr/
fr
AIzaSyAYiBZKx7MnpbEhh9jyipgxe19OcubqV5w
April 1, 2024
152367
Hungary
HUN
true
2
1
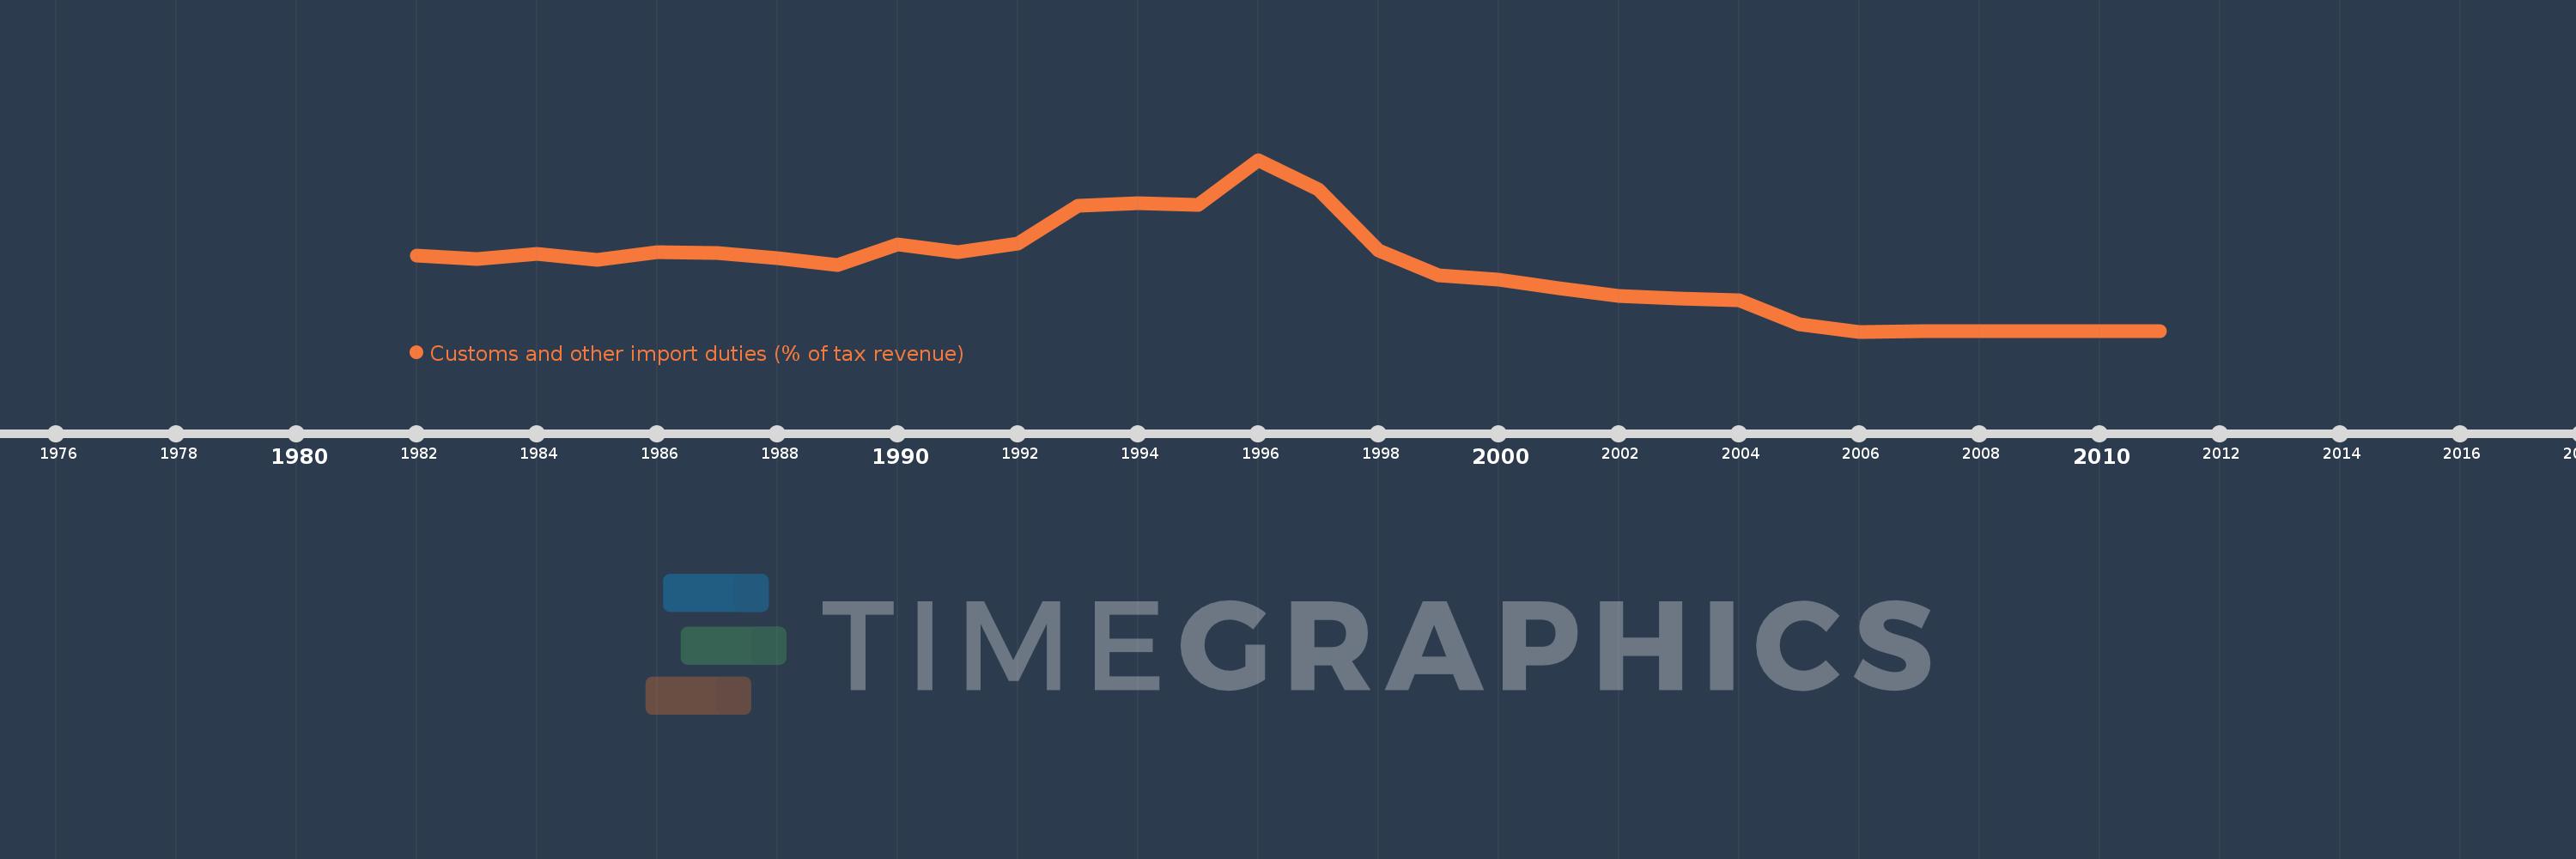
Customs and other import duties (% of tax revenue)
2011,2010,2009,2008,2007,2006,2005,2004,2003,2002,2001,2000,1999,1998,1997,1996,1995,1994,1993,1992,1991,1990,1989,1988,1987,1986,1985,1984,1983,1982
Cette statistique dans les autres pays:
AfghanistanAlbaniaAlgeriaAngolaAntigua and BarbudaArgentinaArmeniaAustraliaAustriaAzerbaijanBahamas, TheBahrainBangladeshBarbadosBelarusBelizeBeninBhutanBoliviaBosnia and HerzegovinaBotswanaBrazilBulgariaBurkina FasoBurundiCabo VerdeCambodiaCentral African RepublicChileChinaColombiaCongo, Dem. Rep.Congo, Rep.Costa RicaCote d'IvoireCroatiaCyprusCzech RepublicDenmarkDominicaDominican RepublicEgypt, Arab Rep.El SalvadorEquatorial GuineaEstoniaEthiopiaFijiFinlandFranceGambia, TheGeorgiaGermanyGhanaGreeceGrenadaGuatemalaHondurasHong Kong SAR, ChinaHungaryIcelandIndiaIndonesiaIran, Islamic Rep.IraqIrelandIsraelItalyJamaicaJapanJordanKazakhstanKenyaKiribatiKorea, Rep.KuwaitKyrgyz RepublicLao PDRLatviaLebanonLiberiaLithuaniaLuxembourgMacedonia, FYRMadagascarMalawiMalaysiaMaldivesMaliMaltaMauritiusMexicoMicronesia, Fed. Sts.MoldovaMongoliaMoroccoMozambiqueMyanmarNamibiaNepalNetherlandsNew ZealandNicaraguaNorwayOmanPakistanPanamaPapua New GuineaParaguayPeruPhilippinesPolandPortugalQatarRomaniaRussian FederationRwandaSamoaSan MarinoSao Tome and PrincipeSenegalSerbiaSeychellesSierra LeoneSingaporeSlovak RepublicSloveniaSolomon IslandsSouth AfricaSpainSri LankaSt. Kitts and NevisSt. LuciaSurinameSwazilandSwedenSwitzerlandSyrian Arab RepublicTajikistanTanzaniaThailandTogoTrinidad and TobagoTunisiaTurkeyUgandaUkraineUnited Arab EmiratesUnited KingdomUnited StatesUruguayVanuatuVenezuela, RBVietnamWest Bank and GazaYemen, Rep.ZambiaZimbabwe La ligne de temps
Cette échelle de temps montre un graphique de 1982 année à 2011 année Hungary. Les données jusqu'à 1981 année ne sont pas présentés. Quantité d'observations actuelles selon dates: 30.
Source (désignation):
Les indicateurs du développement mondiale
Source (organisation):
International Monetary Fund, Government Finance Statistics Yearbook and data files.
Catégories:
Public Sector, Trade
Dernière mise à jour
23 avr. 2017
Les indicateurs de changement de valeurs selon les années
Minimum:
-0.018
1 janv. 2006
Maximum:
18.538
1 janv. 1996
Pour la date d''observation
Valeur
Changement absolu
Le changement par rapport à la valeur précédente
1 janv. 1982
8.188
+8.188
0.0%
1 janv. 1983
7.867
-0.321
-3.92%
1 janv. 1984
8.35
+0.484
6.15%
1 janv. 1985
7.769
-0.582
-6.97%
1 janv. 1986
8.574
+0.805
10.37%
1 janv. 1987
8.437
-0.138
-1.6%
1 janv. 1988
7.921
-0.515
-6.11%
1 janv. 1989
7.208
-0.713
-9.0%
1 janv. 1990
9.437
+2.228
30.92%
1 janv. 1991
8.578
-0.859
-9.1%
1 janv. 1992
9.464
+0.886
10.33%
1 janv. 1993
13.605
+4.141
43.76%
1 janv. 1994
13.896
+0.291
2.14%
1 janv. 1995
13.708
-0.188
-1.35%
1 janv. 1996
18.538
+4.83
35.23%
1 janv. 1997
15.321
-3.216
-17.35%
1 janv. 1998
8.781
-6.541
-42.69%
1 janv. 1999
6.099
-2.682
-30.54%
1 janv. 2000
5.601
-0.498
-8.17%
1 janv. 2001
4.647
-0.953
-17.02%
1 janv. 2002
3.813
-0.834
-17.95%
1 janv. 2003
3.571
-0.243
-6.36%
1 janv. 2004
3.363
-0.208
-5.83%
1 janv. 2005
0.744
-2.619
-77.88%
1 janv. 2006
-0.018
-0.761
-102.39%
1 janv. 2007
-0.004
+0.014
-77.1%
1 janv. 2008
-0.004
+0.0
-9.51%
1 janv. 2009
-0.001
+0.003
-78.07%
1 janv. 2010
-0.001
0.0
12.64%
1 janv. 2011
0.0
+0.001
-84.08%
Classement des pays selon les statistiques actuelles par années


Commentaires: