30
/fr/
AIzaSyAYiBZKx7MnpbEhh9jyipgxe19OcubqV5w
April 1, 2024
150850
Honduras
HND
true
2
1
Patent applications, residents
2014,2013,2012,2003,2002,2001,2000,1999,1997,1996,1991,1988,1986,1985,1984,1983,1981,1979,1978,1977,1975,1974,1973,1972
Download
Bibliothèque de statistiques globales →Honduras →

Patent applications, residents

Cette statistique dans les autres pays:

AlbaniaAlgeriaAngolaArab WorldArgentinaArmeniaArubaAustraliaAustriaAzerbaijanBahamas, TheBahrainBangladeshBarbadosBelarusBelgiumBelizeBhutanBoliviaBosnia and HerzegovinaBotswanaBrazilBrunei DarussalamBulgariaBurkina FasoBurundiCambodiaCanadaCaribbean small statesCentral Europe and the BalticsChileChinaColombiaCongo, Dem. Rep.Congo, Rep.Costa RicaCote d'IvoireCroatiaCubaCyprusCzech RepublicDenmarkDjiboutiDominican RepublicEarly-demographic dividendEast Asia & PacificEast Asia & Pacific (excluding high income)East Asia & Pacific (IDA & IBRD countries)EcuadorEgypt, Arab Rep.El SalvadorEstoniaEthiopiaEuro areaEurope & Central AsiaEurope & Central Asia (excluding high income)Europe & Central Asia (IDA & IBRD countries)European UnionFijiFinlandFranceGeorgiaGermanyGreeceGuatemalaGuyanaHaitiHigh incomeHondurasHong Kong SAR, ChinaHungaryIBRD onlyIcelandIDA & IBRD totalIDA blendIndiaIndonesiaIran, Islamic Rep.IraqIrelandIsraelItalyJamaicaJapanJordanKazakhstanKenyaKiribatiKorea, Dem. People’s Rep.Korea, Rep.KuwaitKyrgyz RepublicLao PDRLate-demographic dividendLatin America & Caribbean Latin America & Caribbean (excluding high income)Latin America & the Caribbean (IDA & IBRD countries)LatviaLebanonLesothoLiberiaLibyaLithuaniaLow & middle incomeLower middle incomeLuxembourgMacao SAR, ChinaMacedonia, FYRMadagascarMalawiMalaysiaMaliMaltaMauritiusMexicoMiddle East & North AfricaMiddle East & North Africa (excluding high income)Middle East & North Africa (IDA & IBRD countries)Middle incomeMoldovaMonacoMongoliaMontenegroMoroccoMozambiqueNamibiaNepalNetherlandsNew ZealandNicaraguaNigeriaNorth AmericaNorwayOECD membersPakistanPanamaPapua New GuineaParaguayPeruPhilippinesPolandPortugalPost-demographic dividendQatarRomaniaRussian FederationRwandaSamoaSaudi ArabiaSerbiaSierra LeoneSingaporeSlovak RepublicSloveniaSomaliaSouth AfricaSouth AsiaSouth Asia (IDA & IBRD)SpainSri LankaSudanSwazilandSwedenSwitzerlandSyrian Arab RepublicTajikistanTanzaniaThailandTrinidad and TobagoTunisiaTurkeyTurkmenistanUgandaUkraineUnited Arab EmiratesUnited KingdomUnited StatesUpper middle incomeUruguayUzbekistanVenezuela, RBVietnamWorldYemen, Rep.ZambiaZimbabwe

La ligne de temps

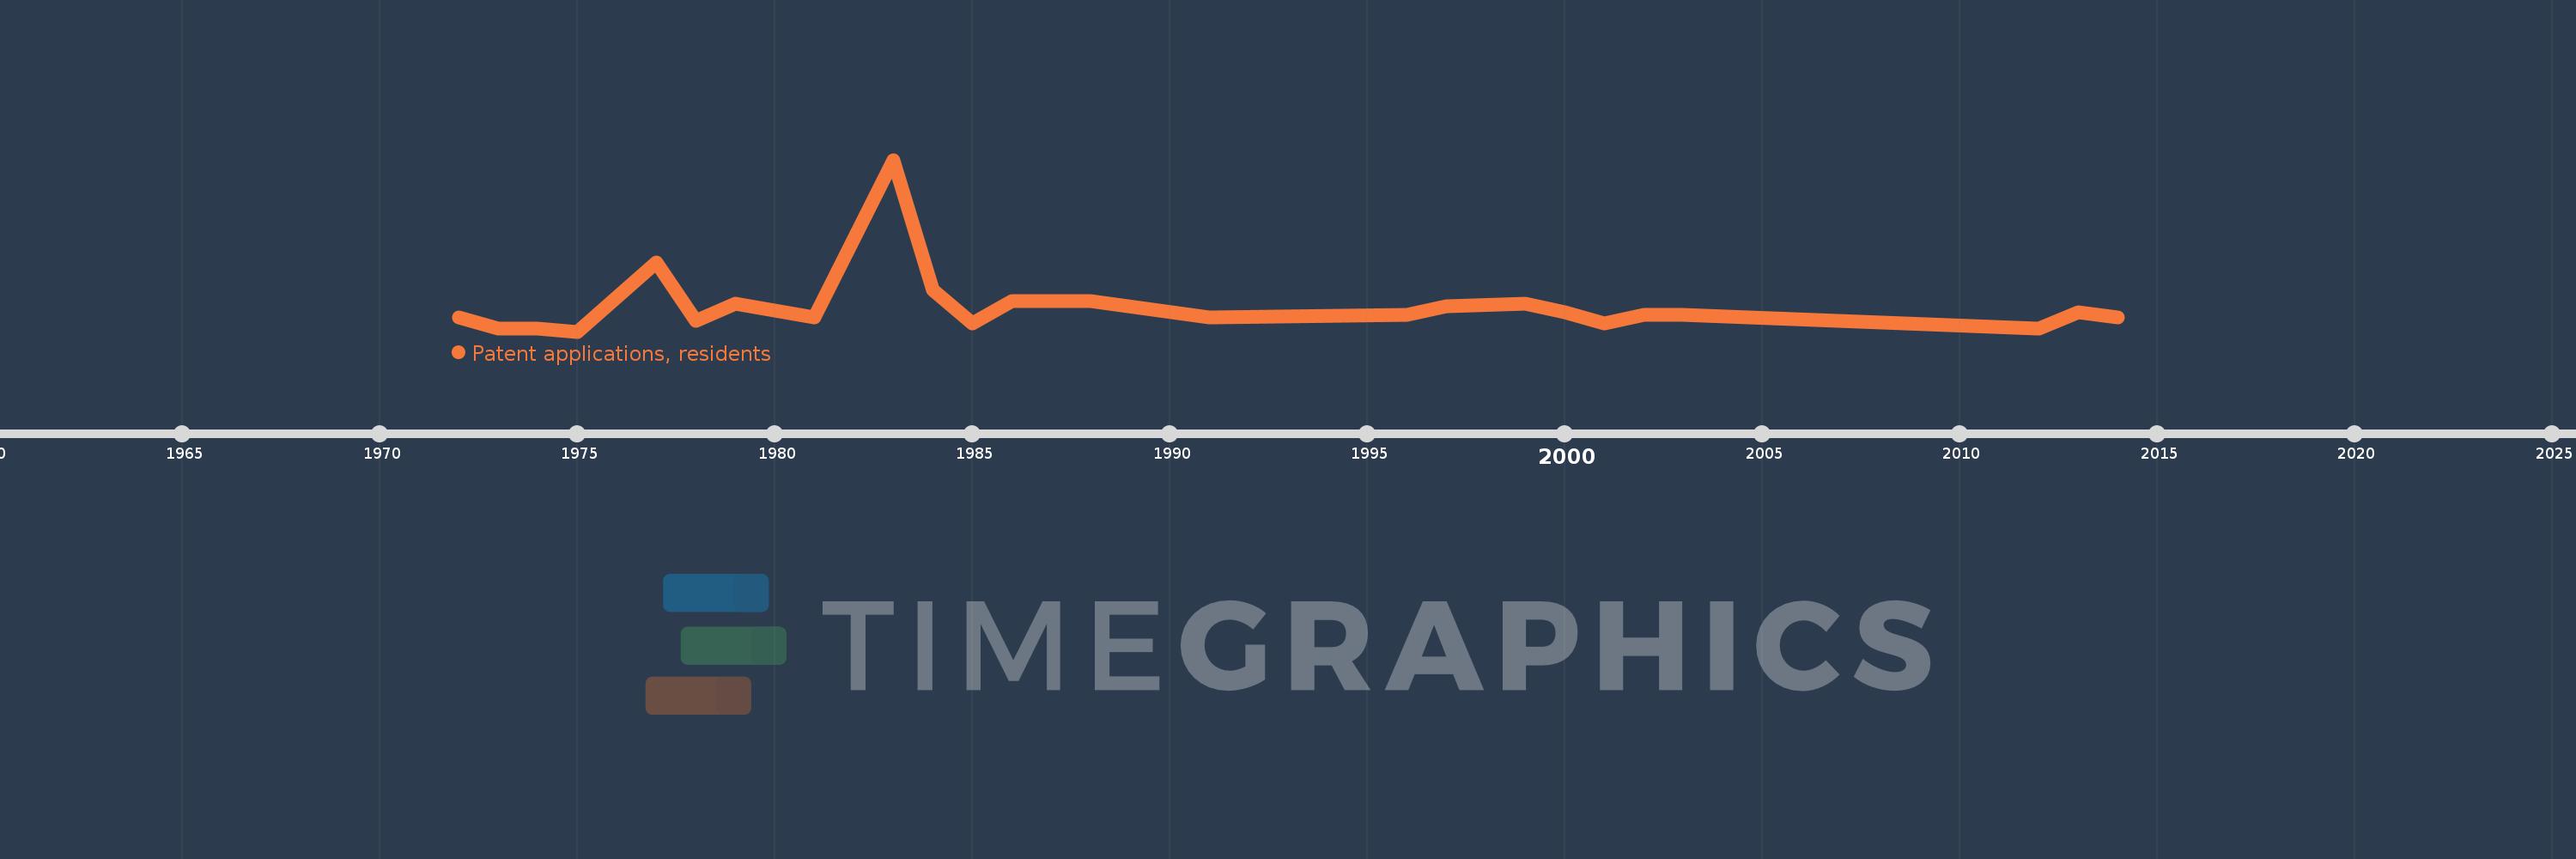
Cette échelle de temps montre un graphique de 1972 année à 2014 année Honduras. Les données jusqu'à 1971 année ne sont pas présentés. Quantité d'observations actuelles selon dates: 24.

Source (désignation):

Les indicateurs du développement mondiale

Source (organisation):

World Intellectual Property Organization (WIPO), WIPO Patent Report: Statistics on Worldwide Patent Activity. The International Bureau of WIPO assumes no responsibility with respect to the transformation of these data.

Catégories:

Science & Technology

Dernière mise à jour

23 avr. 2017

Les indicateurs de changement de valeurs selon les années

En moyenne:
10.083
Minimum:
1.0
1 janv. 1975
Maximum:
63.0
1 janv. 1983
Pour la date d''observation
Valeur
Changement absolu
Le changement par rapport à la valeur précédente
1 janv. 1972
6.0
+6.0
0.0%
1 janv. 1973
2.0
-4.0
-66.67%
1 janv. 1974
2.0
0.0
0.0%
1 janv. 1975
1.0
-1.0
-50.0%
1 janv. 1977
26.0
+25.0
2.5 milles%
1 janv. 1978
5.0
-21.0
-80.77%
1 janv. 1979
11.0
+6.0
120.0%
1 janv. 1981
6.0
-5.0
-45.45%
1 janv. 1983
63.0
+57.0
950.0%
1 janv. 1984
16.0
-47.0
-74.6%
1 janv. 1985
4.0
-12.0
-75.0%
1 janv. 1986
12.0
+8.0
200.0%
1 janv. 1988
12.0
0.0
0.0%
1 janv. 1991
6.0
-6.0
-50.0%
1 janv. 1996
7.0
+1.0
16.67%
1 janv. 1997
10.0
+3.0
42.86%
1 janv. 1999
11.0
+1.0
10.0%
1 janv. 2000
8.0
-3.0
-27.27%
1 janv. 2001
4.0
-4.0
-50.0%
1 janv. 2002
7.0
+3.0
75.0%
1 janv. 2003
7.0
0.0
0.0%
1 janv. 2012
2.0
-5.0
-71.43%
1 janv. 2013
8.0
+6.0
300.0%
1 janv. 2014
6.0
-2.0
-25.0%

Classement des pays selon les statistiques actuelles par années