30
/fr/
AIzaSyAYiBZKx7MnpbEhh9jyipgxe19OcubqV5w
April 1, 2024
148585
Guyana
GUY
true
2
1
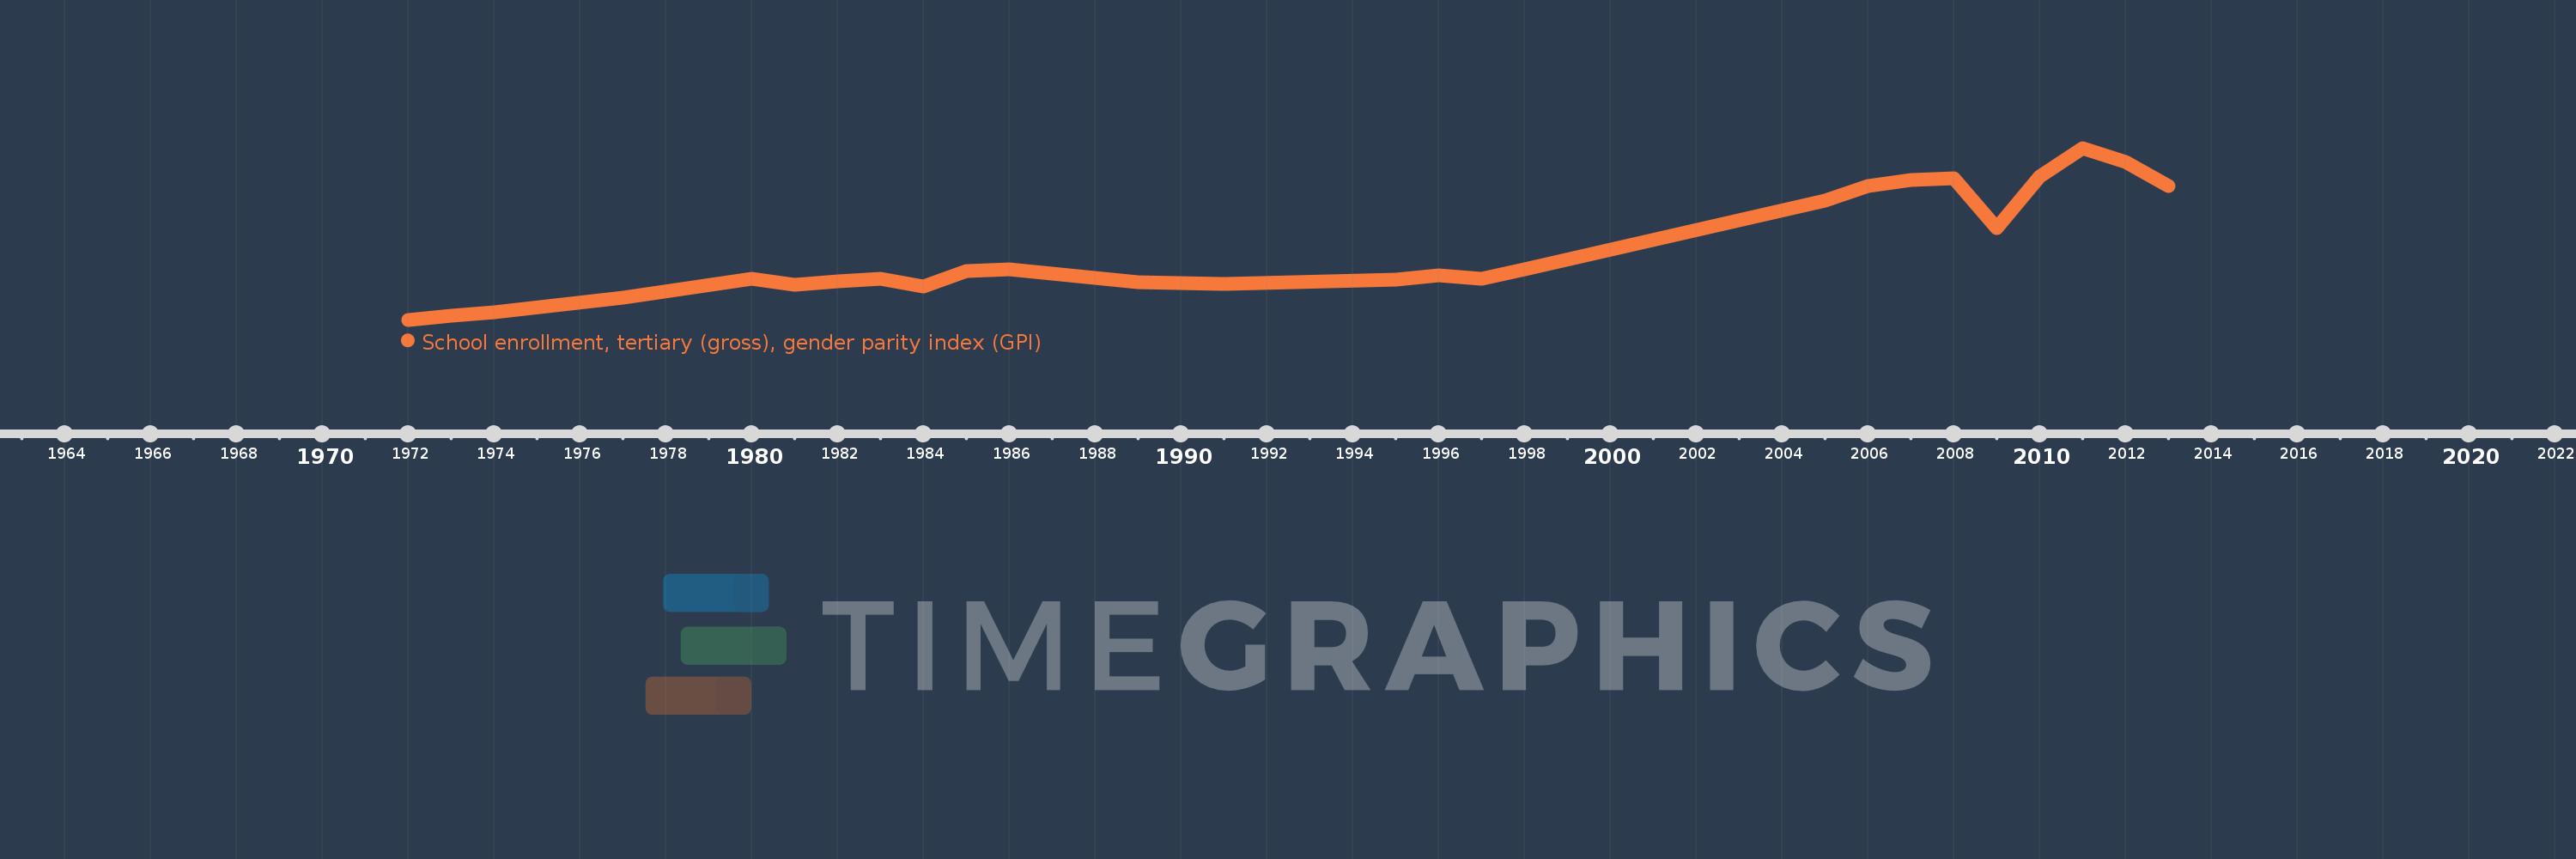
School enrollment, tertiary (gross), gender parity index (GPI)
2013,2012,2011,2010,2009,2008,2007,2006,2005,1998,1997,1996,1995,1991,1989,1987,1986,1985,1984,1983,1982,1981,1980,1977,1974,1973,1972
