29
/fr/
fr
AIzaSyAYiBZKx7MnpbEhh9jyipgxe19OcubqV5w
April 1, 2024
145971
Guinea
GIN
true
2
1
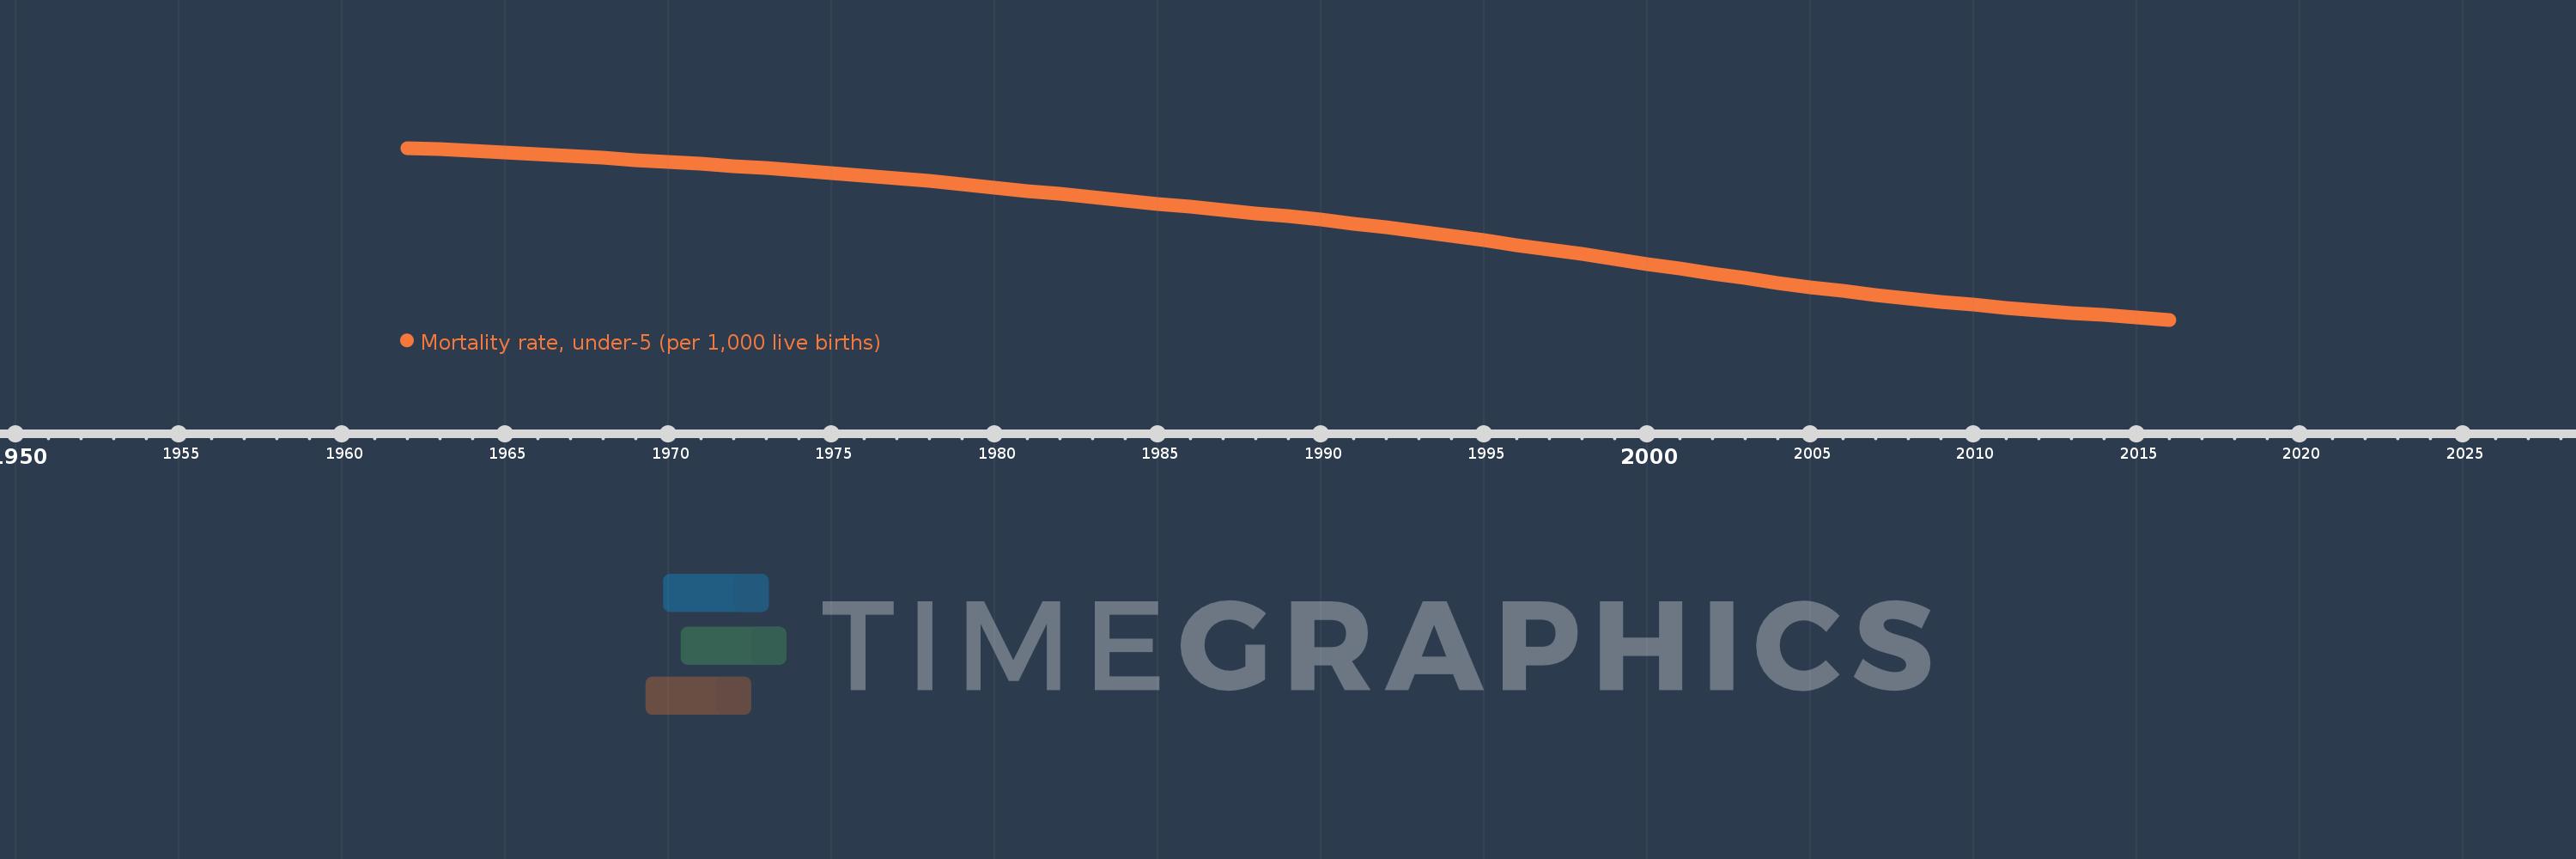
Mortality rate, under-5 (per 1,000 live births)
2016,2015,2014,2013,2012,2011,2010,2009,2008,2007,2006,2005,2004,2003,2002,2001,2000,1999,1998,1997,1996,1995,1994,1993,1992,1991,1990,1989,1988,1987,1986,1985,1984,1983,1982,1981,1980,1979,1978,1977,1976,1975,1974,1973,1972,1971,1970,1969,1968,1967,1966,1965,1964,1963,1962
Cette statistique dans les autres pays:
AfghanistanAlbaniaAlgeriaAndorraAngolaAntigua and BarbudaArab WorldArgentinaArmeniaAustraliaAustriaAzerbaijanBahamas, TheBahrainBangladeshBarbadosBelarusBelgiumBelizeBeninBhutanBoliviaBosnia and HerzegovinaBotswanaBrazilBrunei DarussalamBulgariaBurkina FasoBurundiCabo VerdeCambodiaCameroonCanadaCaribbean small statesCentral African RepublicCentral Europe and the BalticsChadChileChinaColombiaComorosCongo, Dem. Rep.Congo, Rep.Costa RicaCote d'IvoireCroatiaCubaCyprusCzech RepublicDenmarkDjiboutiDominicaDominican RepublicEarly-demographic dividendEast Asia & PacificEast Asia & Pacific (excluding high income)East Asia & Pacific (IDA & IBRD countries)EcuadorEgypt, Arab Rep.El SalvadorEquatorial GuineaEritreaEstoniaEthiopiaEuro areaEurope & Central AsiaEurope & Central Asia (excluding high income)Europe & Central Asia (IDA & IBRD countries)European UnionFijiFinlandFragile and conflict affected situationsFranceGabonGambia, TheGeorgiaGermanyGhanaGreeceGrenadaGuatemalaGuineaGuinea-BissauGuyanaHaitiHeavily indebted poor countries (HIPC)High incomeHondurasHungaryIBRD onlyIcelandIDA & IBRD totalIDA blendIDA onlyIDA totalIndiaIndonesiaIran, Islamic Rep.IraqIrelandIsraelItalyJamaicaJapanJordanKazakhstanKenyaKiribatiKorea, Dem. People’s Rep.Korea, Rep.KuwaitKyrgyz RepublicLao PDRLate-demographic dividendLatin America & Caribbean Latin America & Caribbean (excluding high income)Latin America & the Caribbean (IDA & IBRD countries)LatviaLeast developed countries: UN classificationLebanonLesothoLiberiaLibyaLithuaniaLow & middle incomeLow incomeLower middle incomeLuxembourgMacedonia, FYRMadagascarMalawiMalaysiaMaldivesMaliMaltaMarshall IslandsMauritaniaMauritiusMexicoMicronesia, Fed. Sts.Middle East & North AfricaMiddle East & North Africa (excluding high income)Middle East & North Africa (IDA & IBRD countries)Middle incomeMoldovaMonacoMongoliaMontenegroMoroccoMozambiqueMyanmarNamibiaNauruNepalNetherlandsNew ZealandNicaraguaNigerNigeriaNorth AmericaNorwayOECD membersOmanOther small statesPacific island small statesPakistanPalauPanamaPapua New GuineaParaguayPeruPhilippinesPolandPortugalPost-demographic dividendPre-demographic dividendQatarRomaniaRussian FederationRwandaSamoaSan MarinoSao Tome and PrincipeSaudi ArabiaSenegalSerbiaSeychellesSierra LeoneSingaporeSlovak RepublicSloveniaSmall statesSolomon IslandsSomaliaSouth AfricaSouth AsiaSouth Asia (IDA & IBRD)South SudanSpainSri LankaSt. Kitts and NevisSt. LuciaSt. Vincent and the GrenadinesSub-Saharan Africa Sub-Saharan Africa (excluding high income)Sub-Saharan Africa (IDA & IBRD countries)SudanSurinameSwazilandSwedenSwitzerlandSyrian Arab RepublicTajikistanTanzaniaThailandTimor-LesteTogoTongaTrinidad and TobagoTunisiaTurkeyTurkmenistanTuvaluUgandaUkraineUnited Arab EmiratesUnited KingdomUnited StatesUpper middle incomeUruguayUzbekistanVanuatuVenezuela, RBVietnamWest Bank and GazaWorldYemen, Rep.ZambiaZimbabwe La ligne de temps
Cette échelle de temps montre un graphique de 1962 année à 2016 année Guinea. Les données jusqu'à 1961 année ne sont pas présentés. Quantité d'observations actuelles selon dates: 55.
Source (désignation):
Les indicateurs du développement mondiale
Source (organisation):
Estimates Developed by the UN Inter-agency Group for Child Mortality Estimation (UNICEF, WHO, World Bank, UN DESA Population Division) at www.childmortality.org. Projected data are from the United Nations Population Division's World Population Prospects; and may in some cases not be consistent with data before the current year.
Catégories:
Health, Aid Effectiveness, Climate Change
Dernière mise à jour
23 avr. 2017
Les indicateurs de changement de valeurs selon les années
Maximum:
351.3
1 janv. 1962
Pour la date d''observation
Valeur
Changement absolu
Le changement par rapport à la valeur précédente
1 janv. 1962
351.3
+351.3
0.0%
1 janv. 1963
349.0
-2.3
-0.65%
1 janv. 1964
346.8
-2.2
-0.63%
1 janv. 1965
344.3
-2.5
-0.72%
1 janv. 1966
341.9
-2.4
-0.7%
1 janv. 1967
339.0
-2.9
-0.85%
1 janv. 1968
336.2
-2.8
-0.83%
1 janv. 1969
333.3
-2.9
-0.86%
1 janv. 1970
330.2
-3.1
-0.93%
1 janv. 1971
327.2
-3.0
-0.91%
1 janv. 1972
324.1
-3.1
-0.95%
1 janv. 1973
320.8
-3.3
-1.02%
1 janv. 1974
317.5
-3.3
-1.03%
1 janv. 1975
313.9
-3.6
-1.13%
1 janv. 1976
310.1
-3.8
-1.21%
1 janv. 1977
305.9
-4.2
-1.35%
1 janv. 1978
301.4
-4.5
-1.47%
1 janv. 1979
296.7
-4.7
-1.56%
1 janv. 1980
291.9
-4.8
-1.62%
1 janv. 1981
286.9
-5.0
-1.71%
1 janv. 1982
282.2
-4.7
-1.64%
1 janv. 1983
277.4
-4.8
-1.7%
1 janv. 1984
272.6
-4.8
-1.73%
1 janv. 1985
267.8
-4.8
-1.76%
1 janv. 1986
263.1
-4.7
-1.76%
1 janv. 1987
258.4
-4.7
-1.79%
1 janv. 1988
253.6
-4.8
-1.86%
1 janv. 1989
248.8
-4.8
-1.89%
1 janv. 1990
243.7
-5.1
-2.05%
1 janv. 1991
238.2
-5.5
-2.26%
1 janv. 1992
232.4
-5.8
-2.43%
1 janv. 1993
226.2
-6.2
-2.67%
1 janv. 1994
219.7
-6.5
-2.87%
1 janv. 1995
212.9
-6.8
-3.1%
1 janv. 1996
205.9
-7.0
-3.29%
1 janv. 1997
199.0
-6.9
-3.35%
1 janv. 1998
192.0
-7.0
-3.52%
1 janv. 1999
184.8
-7.2
-3.75%
1 janv. 2000
177.5
-7.3
-3.95%
1 janv. 2001
170.2
-7.3
-4.11%
1 janv. 2002
162.9
-7.3
-4.29%
1 janv. 2003
155.8
-7.1
-4.36%
1 janv. 2004
149.0
-6.8
-4.36%
1 janv. 2005
142.7
-6.3
-4.23%
1 janv. 2006
136.7
-6.0
-4.2%
1 janv. 2007
131.2
-5.5
-4.02%
1 janv. 2008
125.9
-5.3
-4.04%
1 janv. 2009
121.0
-4.9
-3.89%
1 janv. 2010
116.3
-4.7
-3.88%
1 janv. 2011
111.9
-4.4
-3.78%
1 janv. 2012
107.7
-4.2
-3.75%
1 janv. 2013
104.0
-3.7
-3.44%
1 janv. 2014
100.4
-3.6
-3.46%
1 janv. 2015
97.0
-3.4
-3.39%
1 janv. 2016
93.7
-3.3
-3.4%
Classement des pays selon les statistiques actuelles par années


Commentaires: