29
/fr/
fr
AIzaSyAYiBZKx7MnpbEhh9jyipgxe19OcubqV5w
April 1, 2024
145521
Guinea
GIN
true
2
1
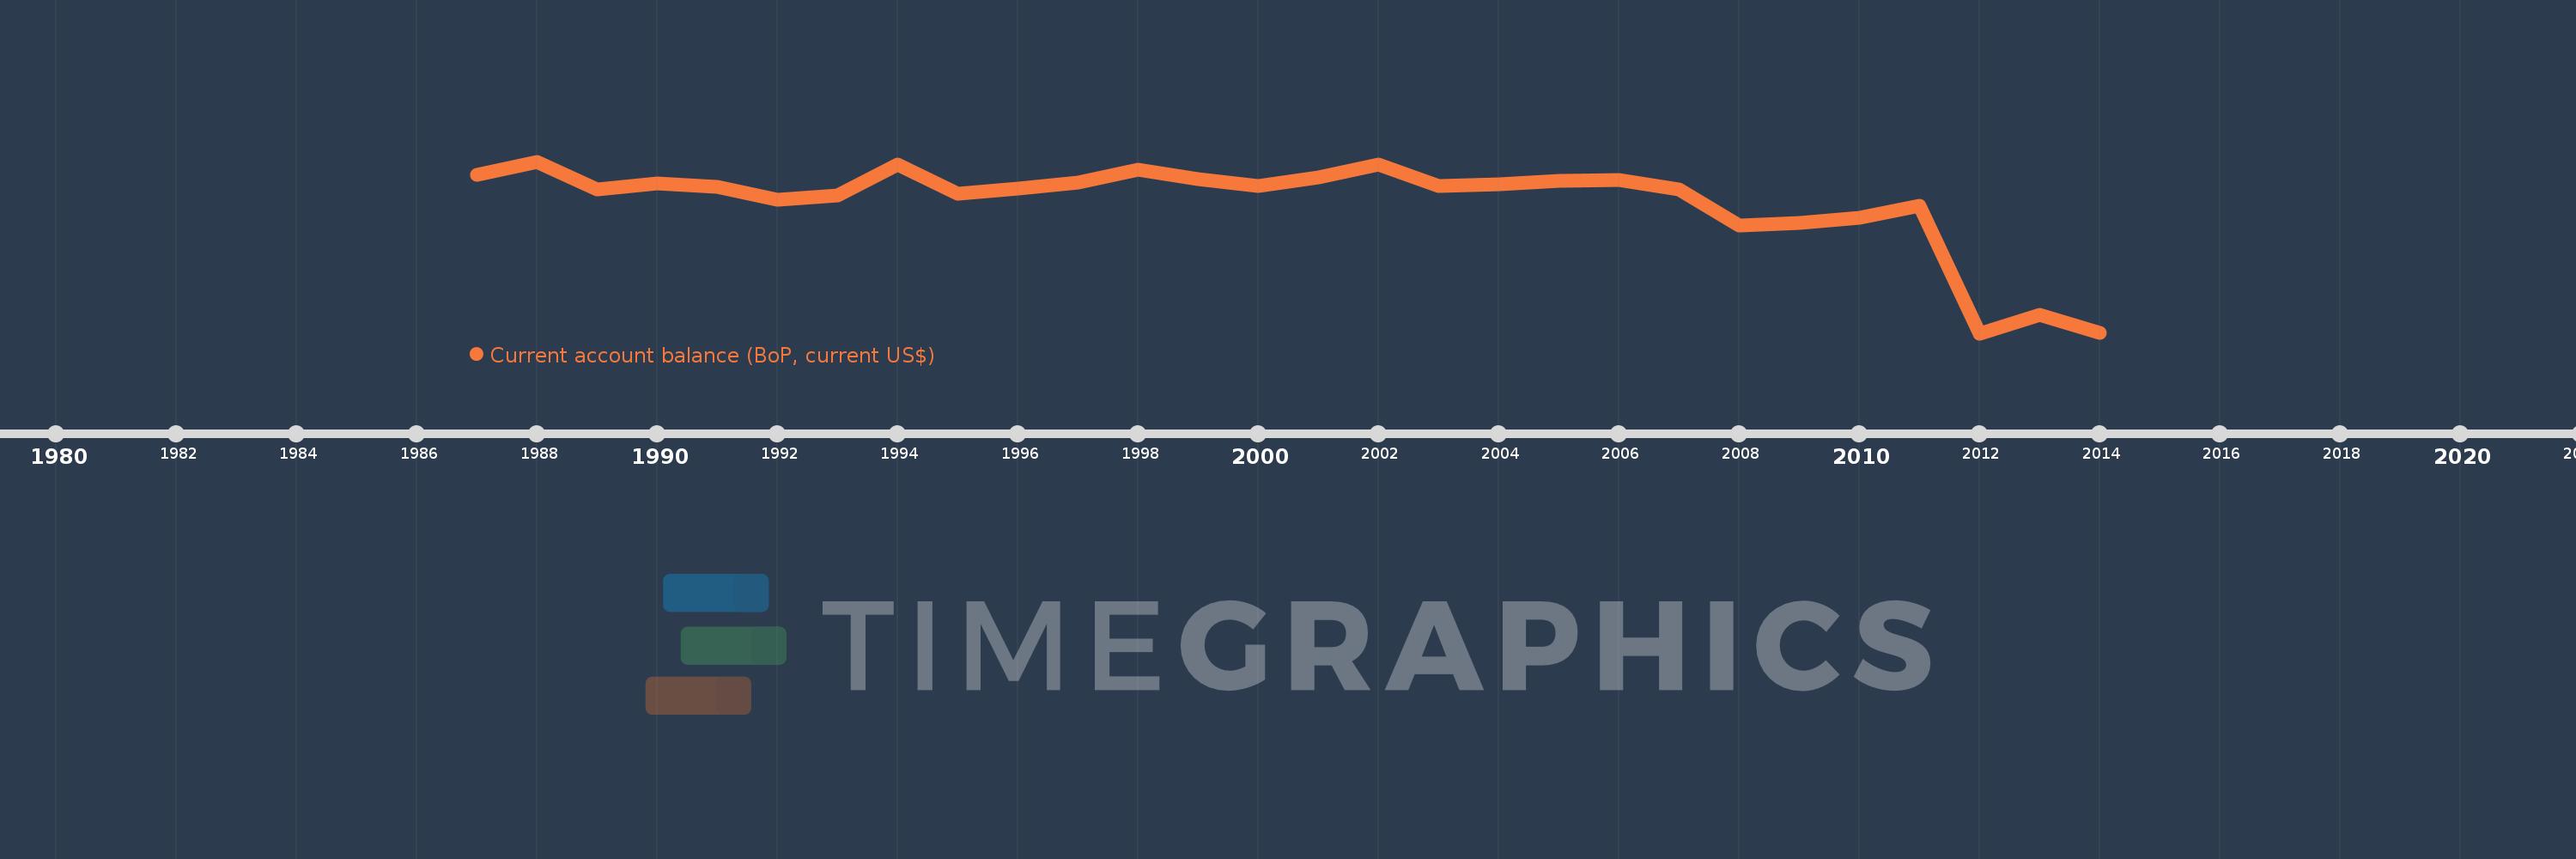
Current account balance (BoP, current US$)
2014,2013,2012,2011,2010,2009,2008,2007,2006,2005,2004,2003,2002,2001,2000,1999,1998,1997,1996,1995,1994,1993,1992,1991,1990,1989,1988,1987
Cette statistique dans les autres pays:
AfghanistanAlbaniaAlgeriaAngolaAntigua and BarbudaArgentinaArmeniaArubaAustraliaAustriaAzerbaijanBahamas, TheBahrainBangladeshBarbadosBelarusBelgiumBelizeBeninBermudaBhutanBoliviaBosnia and HerzegovinaBotswanaBrazilBrunei DarussalamBulgariaBurkina FasoBurundiCabo VerdeCambodiaCameroonCanadaCentral African RepublicChadChileChinaColombiaComorosCongo, Dem. Rep.Congo, Rep.Costa RicaCote d'IvoireCroatiaCuracaoCyprusCzech RepublicDenmarkDjiboutiDominicaDominican RepublicEcuadorEgypt, Arab Rep.El SalvadorEquatorial GuineaEritreaEstoniaEthiopiaEuro areaFaroe IslandsFijiFinlandFranceFrench PolynesiaGabonGambia, TheGeorgiaGermanyGhanaGreeceGrenadaGuatemalaGuineaGuinea-BissauGuyanaHaitiHondurasHong Kong SAR, ChinaHungaryIcelandIndiaIndonesiaIran, Islamic Rep.IraqIrelandIsraelItalyJamaicaJapanJordanKazakhstanKenyaKiribatiKorea, Rep.KosovoKuwaitKyrgyz RepublicLao PDRLatviaLebanonLesothoLiberiaLibyaLithuaniaLuxembourgMacao SAR, ChinaMacedonia, FYRMadagascarMalawiMalaysiaMaldivesMaliMaltaMarshall IslandsMauritaniaMauritiusMexicoMicronesia, Fed. Sts.MoldovaMongoliaMontenegroMoroccoMozambiqueMyanmarNamibiaNepalNetherlandsNew CaledoniaNew ZealandNicaraguaNigerNigeriaNorwayOmanPakistanPalauPanamaPapua New GuineaParaguayPeruPhilippinesPolandPortugalQatarRomaniaRussian FederationRwandaSamoaSao Tome and PrincipeSaudi ArabiaSenegalSerbiaSeychellesSierra LeoneSingaporeSint Maarten (Dutch part)Slovak RepublicSloveniaSolomon IslandsSouth AfricaSouth SudanSpainSri LankaSt. Kitts and NevisSt. LuciaSt. Vincent and the GrenadinesSudanSurinameSwazilandSwedenSwitzerlandSyrian Arab RepublicTajikistanTanzaniaThailandTimor-LesteTogoTongaTrinidad and TobagoTunisiaTurkeyTuvaluUgandaUkraineUnited KingdomUnited StatesUruguayVanuatuVenezuela, RBVietnamWest Bank and GazaYemen, Rep.ZambiaZimbabwe La ligne de temps
Cette échelle de temps montre un graphique de 1987 année à 2014 année Guinea. Les données jusqu'à 1986 année ne sont pas présentés. Quantité d'observations actuelles selon dates: 28.
Source (désignation):
Les indicateurs du développement mondiale
Source (organisation):
International Monetary Fund, Balance of Payments Statistics Yearbook and data files.
Catégories:
Economy & Growth, External Debt
Dernière mise à jour
23 avr. 2017
Les indicateurs de changement de valeurs selon les années
Minimum:
-1.161 mds
1 janv. 2012
Maximum:
-38.25 mln.
1 janv. 1988
Pour la date d''observation
Valeur
Changement absolu
Le changement par rapport à la valeur précédente
1 janv. 1987
-123.88 mln.
-123.88 mln.
0.0%
1 janv. 1988
-38.25 mln.
+85.63 mln.
-69.12%
1 janv. 1989
-221.52 mln.
-183.27 mln.
479.14%
1 janv. 1990
-179.71 mln.
+41.81 mln.
-18.87%
1 janv. 1991
-202.98 mln.
-23.27 mln.
12.95%
1 janv. 1992
-288.82 mln.
-85.84 mln.
42.29%
1 janv. 1993
-262.7 mln.
+26.12 mln.
-9.04%
1 janv. 1994
-56.79 mln.
+205.91 mln.
-78.38%
1 janv. 1995
-247.98 mln.
-191.19 mln.
336.66%
1 janv. 1996
-216.482 mln.
+31.498 mln.
-12.7%
1 janv. 1997
-177.268 mln.
+39.214 mln.
-18.11%
1 janv. 1998
-91.077 mln.
+86.191 mln.
-48.62%
1 janv. 1999
-154.466 mln.
-63.389 mln.
69.6%
1 janv. 2000
-201.047 mln.
-46.58 mln.
30.16%
1 janv. 2001
-140.09 mln.
+60.956 mln.
-30.32%
1 janv. 2002
-59.515 mln.
+80.575 mln.
-57.52%
1 janv. 2003
-199.627 mln.
-140.112 mln.
235.42%
1 janv. 2004
-185.261 mln.
+14.365 mln.
-7.2%
1 janv. 2005
-162.35 mln.
+22.911 mln.
-12.37%
1 janv. 2006
-160.34 mln.
+2.01 mln.
-1.24%
1 janv. 2007
-221.35 mln.
-61.01 mln.
38.05%
1 janv. 2008
-454.59 mln.
-233.24 mln.
105.37%
1 janv. 2009
-438.21 mln.
+16.38 mln.
-3.6%
1 janv. 2010
-403.36 mln.
+34.85 mln.
-7.95%
1 janv. 2011
-326.93 mln.
+76.43 mln.
-18.95%
1 janv. 2012
-1.161 mds
-834.44 mln.
255.24%
1 janv. 2013
-1.039 mds
+122.75 mln.
-10.57%
1 janv. 2014
-1.161 mds
-122.33 mln.
11.78%
Classement des pays selon les statistiques actuelles par années


Commentaires: