29
/fr/
fr
AIzaSyAYiBZKx7MnpbEhh9jyipgxe19OcubqV5w
April 1, 2024
144614
Guatemala
GTM
true
2
1
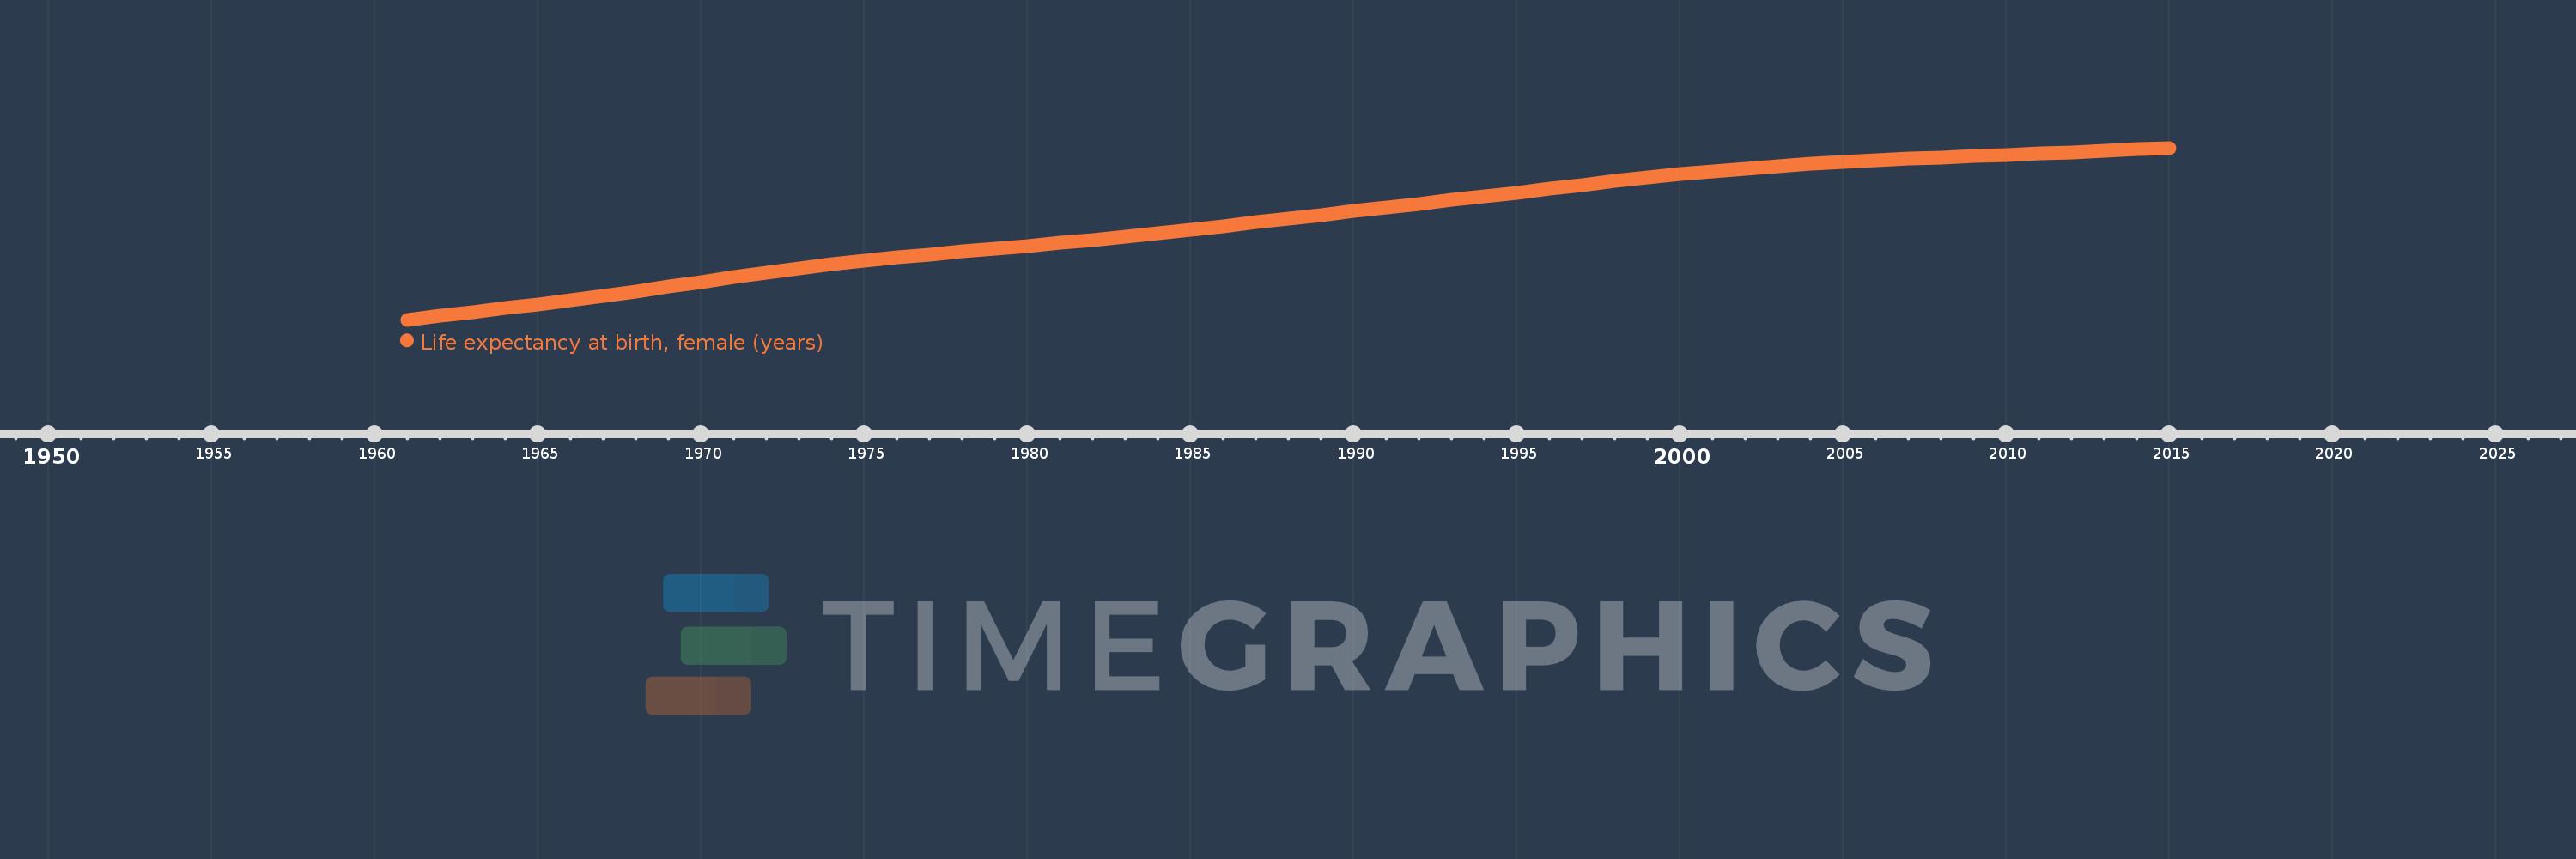
Life expectancy at birth, female (years)
2015,2014,2013,2012,2011,2010,2009,2008,2007,2006,2005,2004,2003,2002,2001,2000,1999,1998,1997,1996,1995,1994,1993,1992,1991,1990,1989,1988,1987,1986,1985,1984,1983,1982,1981,1980,1979,1978,1977,1976,1975,1974,1973,1972,1971,1970,1969,1968,1967,1966,1965,1964,1963,1962,1961
Cette statistique dans les autres pays:
AfghanistanAlbaniaAlgeriaAngolaAntigua and BarbudaArab WorldArgentinaArmeniaArubaAustraliaAustriaAzerbaijanBahamas, TheBahrainBangladeshBarbadosBelarusBelgiumBelizeBeninBermudaBhutanBoliviaBosnia and HerzegovinaBotswanaBrazilBrunei DarussalamBulgariaBurkina FasoBurundiCabo VerdeCambodiaCameroonCanadaCaribbean small statesCentral African RepublicCentral Europe and the BalticsChadChannel IslandsChileChinaColombiaComorosCongo, Dem. Rep.Congo, Rep.Costa RicaCote d'IvoireCroatiaCubaCuracaoCyprusCzech RepublicDenmarkDjiboutiDominicaDominican RepublicEarly-demographic dividendEast Asia & PacificEast Asia & Pacific (excluding high income)East Asia & Pacific (IDA & IBRD countries)EcuadorEgypt, Arab Rep.El SalvadorEquatorial GuineaEritreaEstoniaEthiopiaEuro areaEurope & Central AsiaEurope & Central Asia (excluding high income)Europe & Central Asia (IDA & IBRD countries)European UnionFaroe IslandsFijiFinlandFragile and conflict affected situationsFranceFrench PolynesiaGabonGambia, TheGeorgiaGermanyGhanaGreeceGreenlandGrenadaGuamGuatemalaGuineaGuinea-BissauGuyanaHaitiHeavily indebted poor countries (HIPC)High incomeHondurasHong Kong SAR, ChinaHungaryIBRD onlyIcelandIDA & IBRD totalIDA blendIDA onlyIDA totalIndiaIndonesiaIran, Islamic Rep.IraqIrelandIsle of ManIsraelItalyJamaicaJapanJordanKazakhstanKenyaKiribatiKorea, Dem. People’s Rep.Korea, Rep.KosovoKuwaitKyrgyz RepublicLao PDRLate-demographic dividendLatin America & Caribbean Latin America & Caribbean (excluding high income)Latin America & the Caribbean (IDA & IBRD countries)LatviaLeast developed countries: UN classificationLebanonLesothoLiberiaLibyaLiechtensteinLithuaniaLow & middle incomeLow incomeLower middle incomeLuxembourgMacao SAR, ChinaMacedonia, FYRMadagascarMalawiMalaysiaMaldivesMaliMaltaMarshall IslandsMauritaniaMauritiusMexicoMicronesia, Fed. Sts.Middle East & North AfricaMiddle East & North Africa (excluding high income)Middle East & North Africa (IDA & IBRD countries)Middle incomeMoldovaMongoliaMontenegroMoroccoMozambiqueMyanmarNamibiaNepalNetherlandsNew CaledoniaNew ZealandNicaraguaNigerNigeriaNorth AmericaNorwayOECD membersOmanOther small statesPacific island small statesPakistanPalauPanamaPapua New GuineaParaguayPeruPhilippinesPolandPortugalPost-demographic dividendPre-demographic dividendPuerto RicoQatarRomaniaRussian FederationRwandaSamoaSan MarinoSao Tome and PrincipeSaudi ArabiaSenegalSerbiaSeychellesSierra LeoneSingaporeSint Maarten (Dutch part)Slovak RepublicSloveniaSmall statesSolomon IslandsSomaliaSouth AfricaSouth AsiaSouth Asia (IDA & IBRD)South SudanSpainSri LankaSt. Kitts and NevisSt. LuciaSt. Martin (French part)St. Vincent and the GrenadinesSub-Saharan Africa Sub-Saharan Africa (excluding high income)Sub-Saharan Africa (IDA & IBRD countries)SudanSurinameSwazilandSwedenSwitzerlandSyrian Arab RepublicTajikistanTanzaniaThailandTimor-LesteTogoTongaTrinidad and TobagoTunisiaTurkeyTurkmenistanUgandaUkraineUnited Arab EmiratesUnited KingdomUnited StatesUpper middle incomeUruguayUzbekistanVanuatuVenezuela, RBVietnamVirgin Islands (U.S.)West Bank and GazaWorldYemen, Rep.ZambiaZimbabwe La ligne de temps
Cette échelle de temps montre un graphique de 1961 année à 2015 année Guatemala. Les données jusqu'à 1960 année ne sont pas présentés. Quantité d'observations actuelles selon dates: 55.
Source (désignation):
Les indicateurs du développement mondiale
Source (organisation):
(1) United Nations Population Division. World Population Prospects, (2) Census reports and other statistical publications from national statistical offices, (3) Eurostat: Demographic Statistics, (4) United Nations Statistical Division. Population and Vital Statistics Reprot (various years), (5) U.S. Census Bureau: International Database, and (6) Secretariat of the Pacific Community: Statistics and Demography Programme.
Catégories:
Health, Gender, Social Development
Dernière mise à jour
23 avr. 2017
Les indicateurs de changement de valeurs selon les années
Minimum:
46.219
1 janv. 1961
Maximum:
75.338
1 janv. 2015
Pour la date d''observation
Valeur
Changement absolu
Le changement par rapport à la valeur précédente
1 janv. 1961
46.219
+46.219
0.0%
1 janv. 1962
46.862
+0.643
1.39%
1 janv. 1963
47.516
+0.654
1.4%
1 janv. 1964
48.178
+0.662
1.39%
1 janv. 1965
48.847
+0.669
1.39%
1 janv. 1966
49.533
+0.686
1.4%
1 janv. 1967
50.249
+0.716
1.45%
1 janv. 1968
51.002
+0.753
1.5%
1 janv. 1969
51.789
+0.787
1.54%
1 janv. 1970
52.599
+0.81
1.56%
1 janv. 1971
53.412
+0.813
1.55%
1 janv. 1972
54.201
+0.789
1.48%
1 janv. 1973
54.944
+0.743
1.37%
1 janv. 1974
55.627
+0.683
1.24%
1 janv. 1975
56.245
+0.618
1.11%
1 janv. 1976
56.802
+0.557
0.99%
1 janv. 1977
57.308
+0.506
0.89%
1 janv. 1978
57.787
+0.479
0.84%
1 janv. 1979
58.26
+0.473
0.82%
1 janv. 1980
58.74
+0.48
0.82%
1 janv. 1981
59.239
+0.499
0.85%
1 janv. 1982
59.764
+0.525
0.89%
1 janv. 1983
60.314
+0.55
0.92%
1 janv. 1984
60.884
+0.57
0.95%
1 janv. 1985
61.476
+0.592
0.97%
1 janv. 1986
62.085
+0.609
0.99%
1 janv. 1987
62.709
+0.624
1.01%
1 janv. 1988
63.338
+0.629
1.0%
1 janv. 1989
63.968
+0.63
0.99%
1 janv. 1990
64.596
+0.628
0.98%
1 janv. 1991
65.224
+0.628
0.97%
1 janv. 1992
65.855
+0.631
0.97%
1 janv. 1993
66.493
+0.638
0.97%
1 janv. 1994
67.137
+0.644
0.97%
1 janv. 1995
67.784
+0.647
0.96%
1 janv. 1996
68.429
+0.645
0.95%
1 janv. 1997
69.067
+0.638
0.93%
1 janv. 1998
69.691
+0.624
0.9%
1 janv. 1999
70.292
+0.601
0.86%
1 janv. 2000
70.861
+0.569
0.81%
1 janv. 2001
71.388
+0.527
0.74%
1 janv. 2002
71.861
+0.473
0.66%
1 janv. 2003
72.279
+0.418
0.58%
1 janv. 2004
72.645
+0.366
0.51%
1 janv. 2005
72.962
+0.317
0.44%
1 janv. 2006
73.238
+0.276
0.38%
1 janv. 2007
73.483
+0.245
0.33%
1 janv. 2008
73.711
+0.228
0.31%
1 janv. 2009
73.934
+0.223
0.3%
1 janv. 2010
74.158
+0.224
0.3%
1 janv. 2011
74.389
+0.231
0.31%
1 janv. 2012
74.626
+0.237
0.32%
1 janv. 2013
74.866
+0.24
0.32%
1 janv. 2014
75.103
+0.237
0.32%
1 janv. 2015
75.338
+0.235
0.31%
Classement des pays selon les statistiques actuelles par années


Commentaires: