29
/fr/
fr
AIzaSyAYiBZKx7MnpbEhh9jyipgxe19OcubqV5w
April 1, 2024
144122
Guatemala
GTM
true
2
1
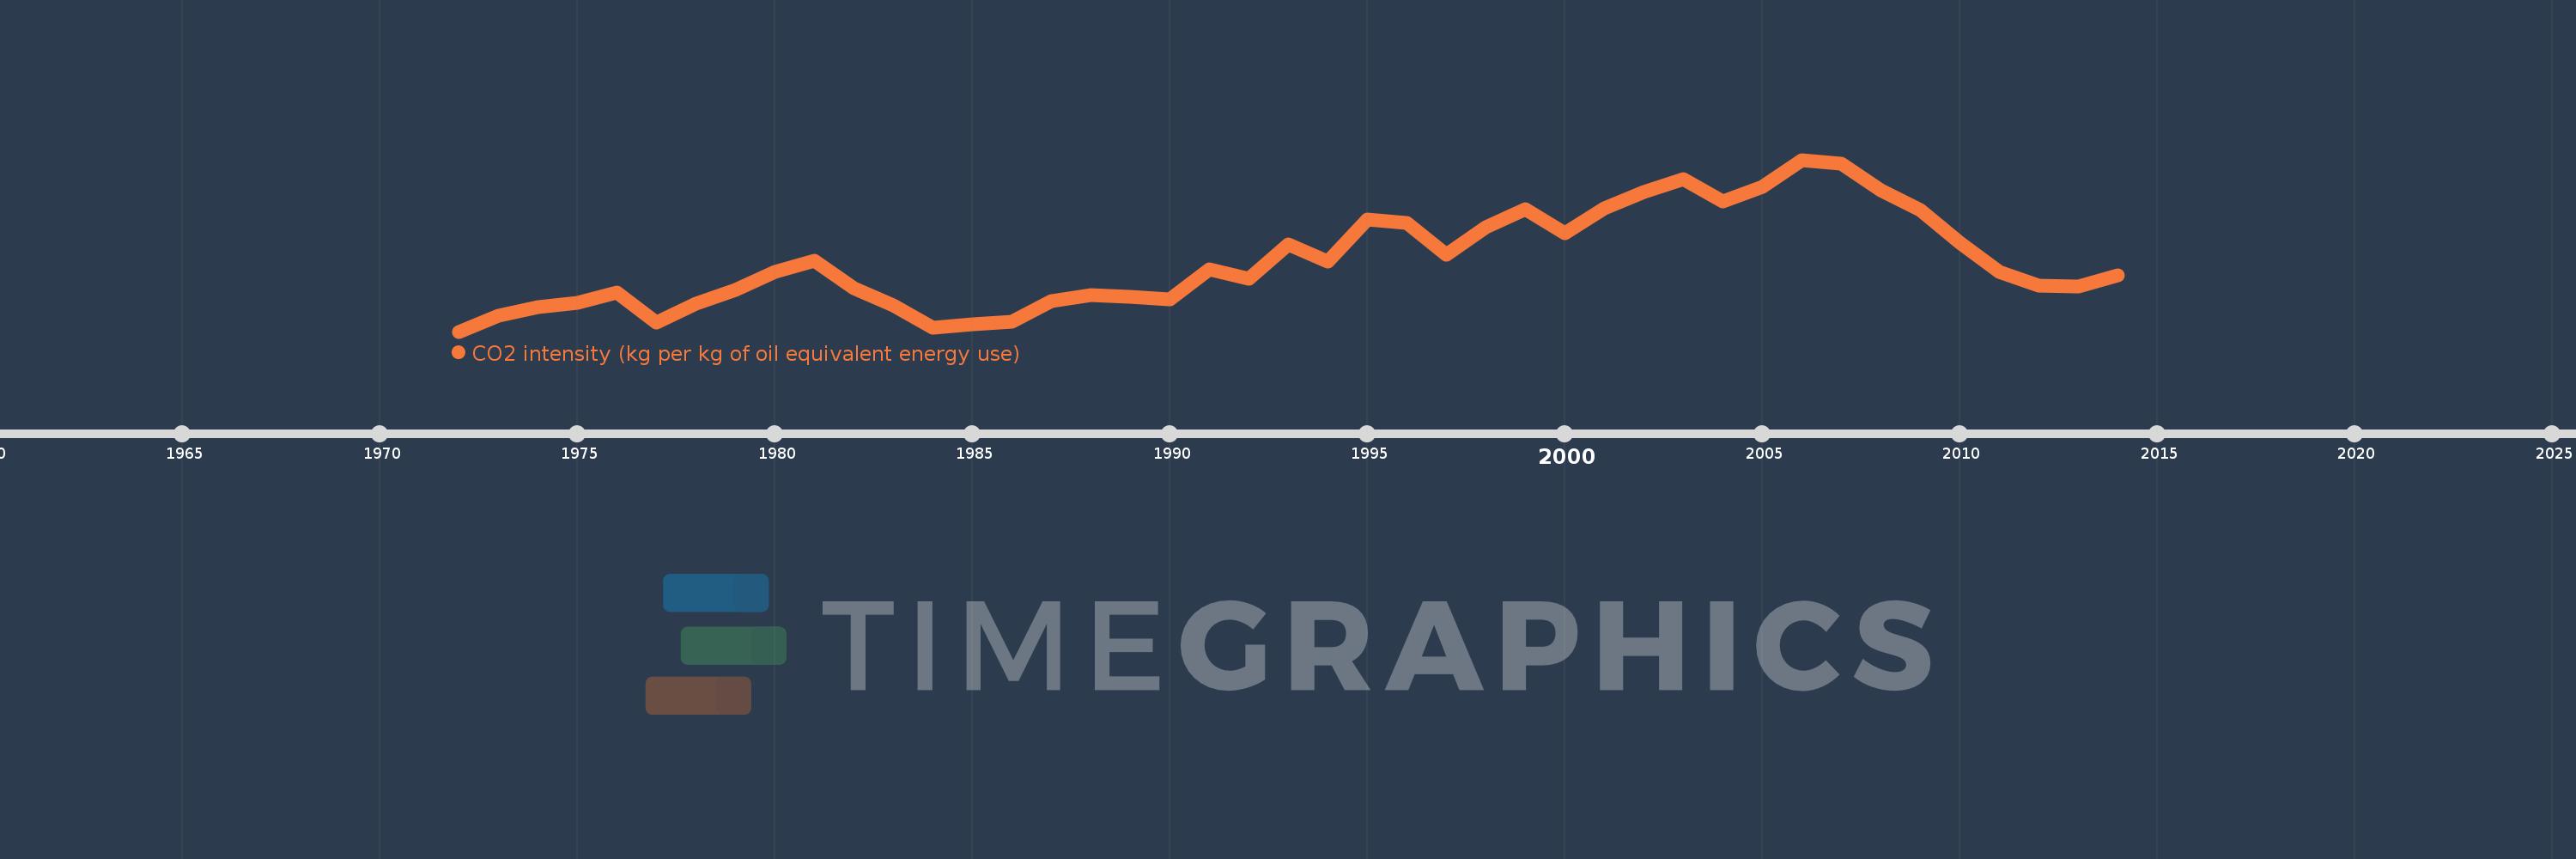
CO2 intensity (kg per kg of oil equivalent energy use)
2014,2013,2012,2011,2010,2009,2008,2007,2006,2005,2004,2003,2002,2001,2000,1999,1998,1997,1996,1995,1994,1993,1992,1991,1990,1989,1988,1987,1986,1985,1984,1983,1982,1981,1980,1979,1978,1977,1976,1975,1974,1973,1972
Cette statistique dans les autres pays:
AlbaniaAlgeriaAngolaAntigua and BarbudaArab WorldArgentinaArmeniaAustraliaAustriaAzerbaijanBahamas, TheBahrainBangladeshBarbadosBelarusBelgiumBelizeBeninBhutanBoliviaBosnia and HerzegovinaBotswanaBrazilBrunei DarussalamBulgariaCabo VerdeCambodiaCameroonCanadaCaribbean small statesCentral Europe and the BalticsChileChinaColombiaComorosCongo, Dem. Rep.Congo, Rep.Costa RicaCote d'IvoireCroatiaCubaCuracaoCyprusCzech RepublicDenmarkDjiboutiDominicaDominican RepublicEarly-demographic dividendEast Asia & PacificEast Asia & Pacific (excluding high income)East Asia & Pacific (IDA & IBRD countries)EcuadorEgypt, Arab Rep.El SalvadorEquatorial GuineaEritreaEstoniaEthiopiaEuro areaEurope & Central AsiaEurope & Central Asia (excluding high income)Europe & Central Asia (IDA & IBRD countries)European UnionFijiFinlandFragile and conflict affected situationsFranceGabonGambia, TheGeorgiaGermanyGhanaGibraltarGreeceGrenadaGuatemalaGuinea-BissauGuyanaHaitiHeavily indebted poor countries (HIPC)High incomeHondurasHong Kong SAR, ChinaHungaryIBRD onlyIcelandIDA & IBRD totalIDA blendIDA onlyIDA totalIndiaIndonesiaIran, Islamic Rep.IraqIrelandIsraelItalyJamaicaJapanJordanKazakhstanKenyaKiribatiKorea, Dem. People’s Rep.Korea, Rep.KuwaitKyrgyz RepublicLate-demographic dividendLatin America & Caribbean Latin America & Caribbean (excluding high income)Latin America & the Caribbean (IDA & IBRD countries)LatviaLeast developed countries: UN classificationLebanonLesothoLibyaLithuaniaLow & middle incomeLow incomeLower middle incomeLuxembourgMacedonia, FYRMalaysiaMaldivesMaltaMarshall IslandsMauritiusMexicoMiddle East & North AfricaMiddle East & North Africa (excluding high income)Middle East & North Africa (IDA & IBRD countries)Middle incomeMoldovaMongoliaMontenegroMoroccoMozambiqueMyanmarNamibiaNepalNetherlandsNew ZealandNicaraguaNigerNigeriaNorth AmericaNorwayOECD membersOmanOther small statesPacific island small statesPakistanPalauPanamaParaguayPeruPhilippinesPolandPortugalPost-demographic dividendPre-demographic dividendQatarRomaniaRussian FederationSamoaSao Tome and PrincipeSaudi ArabiaSenegalSerbiaSeychellesSingaporeSlovak RepublicSloveniaSmall statesSolomon IslandsSouth AfricaSouth AsiaSouth Asia (IDA & IBRD)South SudanSpainSri LankaSt. Kitts and NevisSt. LuciaSt. Vincent and the GrenadinesSub-Saharan Africa Sub-Saharan Africa (excluding high income)Sub-Saharan Africa (IDA & IBRD countries)SudanSurinameSwazilandSwedenSwitzerlandSyrian Arab RepublicTajikistanTanzaniaThailandTimor-LesteTogoTongaTrinidad and TobagoTunisiaTurkeyTurkmenistanUkraineUnited Arab EmiratesUnited KingdomUnited StatesUpper middle incomeUruguayUzbekistanVanuatuVenezuela, RBVietnamWorldYemen, Rep.ZambiaZimbabwe La ligne de temps
Cette échelle de temps montre un graphique de 1972 année à 2014 année Guatemala. Les données jusqu'à 1971 année ne sont pas présentés. Quantité d'observations actuelles selon dates: 43.
Source (désignation):
Les indicateurs du développement mondiale
Source (organisation):
Carbon Dioxide Information Analysis Center, Environmental Sciences Division, Oak Ridge National Laboratory, Tennessee, United States.
Catégories:
Climate Change, Environment
Dernière mise à jour
23 avr. 2017
Les indicateurs de changement de valeurs selon les années
Minimum:
0.893
1 janv. 1972
Maximum:
1.612
1 janv. 2006
Pour la date d''observation
Valeur
Changement absolu
Le changement par rapport à la valeur précédente
1 janv. 1972
0.893
+0.893
0.0%
1 janv. 1973
0.961
+0.068
7.6%
1 janv. 1974
0.997
+0.036
3.76%
1 janv. 1975
1.014
+0.017
1.69%
1 janv. 1976
1.058
+0.044
4.29%
1 janv. 1977
0.929
-0.128
-12.14%
1 janv. 1978
1.009
+0.08
8.61%
1 janv. 1979
1.067
+0.058
5.71%
1 janv. 1980
1.143
+0.076
7.16%
1 janv. 1981
1.189
+0.046
4.04%
1 janv. 1982
1.076
-0.114
-9.56%
1 janv. 1983
1.001
-0.075
-6.97%
1 janv. 1984
0.908
-0.093
-9.28%
1 janv. 1985
0.925
+0.017
1.85%
1 janv. 1986
0.935
+0.01
1.1%
1 janv. 1987
1.022
+0.087
9.36%
1 janv. 1988
1.044
+0.022
2.14%
1 janv. 1989
1.037
-0.007
-0.68%
1 janv. 1990
1.028
-0.009
-0.85%
1 janv. 1991
1.153
+0.125
12.15%
1 janv. 1992
1.114
-0.039
-3.38%
1 janv. 1993
1.258
+0.144
12.91%
1 janv. 1994
1.187
-0.071
-5.66%
1 janv. 1995
1.361
+0.174
14.7%
1 janv. 1996
1.347
-0.014
-1.05%
1 janv. 1997
1.216
-0.13
-9.68%
1 janv. 1998
1.328
+0.111
9.16%
1 janv. 1999
1.407
+0.079
5.94%
1 janv. 2000
1.306
-0.1
-7.13%
1 janv. 2001
1.408
+0.102
7.81%
1 janv. 2002
1.478
+0.07
4.97%
1 janv. 2003
1.531
+0.053
3.58%
1 janv. 2004
1.438
-0.094
-6.12%
1 janv. 2005
1.498
+0.06
4.2%
1 janv. 2006
1.612
+0.114
7.59%
1 janv. 2007
1.597
-0.015
-0.94%
1 janv. 2008
1.483
-0.113
-7.09%
1 janv. 2009
1.401
-0.082
-5.54%
1 janv. 2010
1.266
-0.135
-9.67%
1 janv. 2011
1.144
-0.122
-9.6%
1 janv. 2012
1.086
-0.058
-5.09%
1 janv. 2013
1.081
-0.005
-0.43%
1 janv. 2014
1.129
+0.048
4.4%
Classement des pays selon les statistiques actuelles par années


Commentaires: