29
/fr/
fr
AIzaSyAYiBZKx7MnpbEhh9jyipgxe19OcubqV5w
April 1, 2024
143022
Grenada
GRD
true
2
1
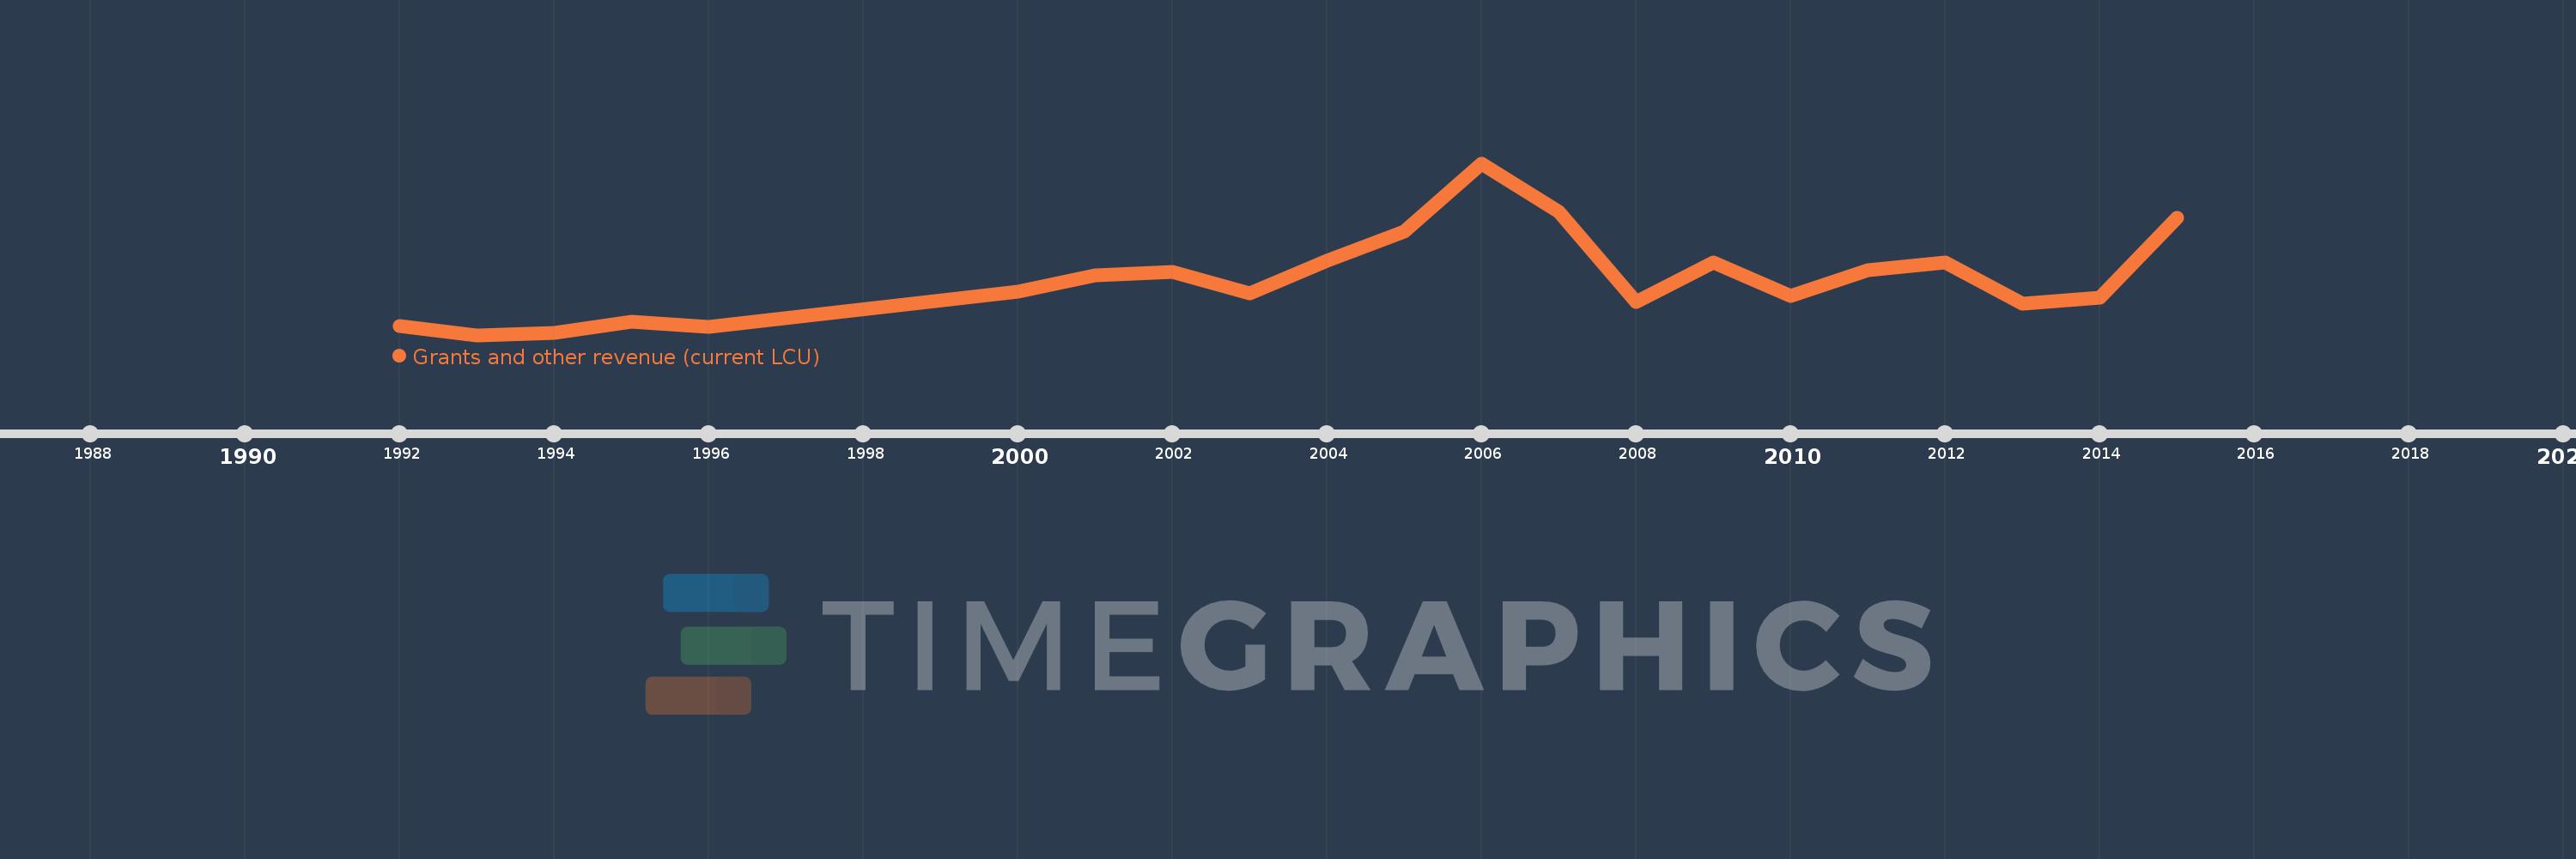
Grants and other revenue (current LCU)
2015,2014,2013,2012,2011,2010,2009,2008,2007,2006,2005,2004,2003,2002,2001,2000,1996,1995,1994,1993,1992
Cette statistique dans les autres pays:
AfghanistanAlbaniaAlgeriaAngolaAntigua and BarbudaArgentinaArmeniaAustraliaAustriaAzerbaijanBahamas, TheBahrainBangladeshBarbadosBelarusBelgiumBelizeBeninBhutanBoliviaBosnia and HerzegovinaBotswanaBrazilBulgariaBurkina FasoBurundiCabo VerdeCambodiaCanadaCentral African RepublicChileChinaColombiaCongo, Dem. Rep.Congo, Rep.Costa RicaCote d'IvoireCroatiaCyprusCzech RepublicDenmarkDominicaDominican RepublicEgypt, Arab Rep.El SalvadorEquatorial GuineaEstoniaEthiopiaFijiFinlandFranceGambia, TheGeorgiaGermanyGhanaGreeceGrenadaGuatemalaHondurasHong Kong SAR, ChinaHungaryIcelandIndiaIndonesiaIran, Islamic Rep.IraqIrelandIsraelItalyJamaicaJapanJordanKazakhstanKenyaKiribatiKorea, Rep.KuwaitKyrgyz RepublicLao PDRLatviaLebanonLesothoLiberiaLithuaniaLuxembourgMacao SAR, ChinaMacedonia, FYRMadagascarMalawiMalaysiaMaldivesMaliMaltaMauritiusMexicoMicronesia, Fed. Sts.MoldovaMongoliaMoroccoMozambiqueMyanmarNamibiaNepalNetherlandsNew ZealandNicaraguaNigeriaNorwayOmanPakistanPanamaPapua New GuineaParaguayPeruPhilippinesPolandPortugalQatarRomaniaRussian FederationRwandaSamoaSan MarinoSao Tome and PrincipeSenegalSerbiaSeychellesSierra LeoneSingaporeSlovak RepublicSloveniaSolomon IslandsSouth AfricaSpainSri LankaSt. Kitts and NevisSt. LuciaSt. Vincent and the GrenadinesSurinameSwazilandSwedenSwitzerlandSyrian Arab RepublicTajikistanTanzaniaThailandTimor-LesteTogoTrinidad and TobagoTunisiaTurkeyUgandaUkraineUnited Arab EmiratesUnited KingdomUnited StatesUruguayVanuatuVenezuela, RBVietnamWest Bank and GazaYemen, Rep.ZambiaZimbabwe La ligne de temps
Cette échelle de temps montre un graphique de 1992 année à 2015 année Grenada. Les données jusqu'à 1991 année ne sont pas présentés. Quantité d'observations actuelles selon dates: 21.
Source (désignation):
Les indicateurs du développement mondiale
Source (organisation):
International Monetary Fund, Government Finance Statistics Yearbook and data files.
Catégories:
Public Sector
Dernière mise à jour
23 avr. 2017
Les indicateurs de changement de valeurs selon les années
Minimum:
14.15 mln.
1 janv. 1993
Maximum:
176.37 mln.
1 janv. 2006
Pour la date d''observation
Valeur
Changement absolu
Le changement par rapport à la valeur précédente
1 janv. 1992
22.77 mln.
+22.77 mln.
0.0%
1 janv. 1993
14.15 mln.
-8.62 mln.
-37.86%
1 janv. 1994
16.33 mln.
+2.18 mln.
15.41%
1 janv. 1995
26.5 mln.
+10.17 mln.
62.28%
1 janv. 1996
21.48 mln.
-5.02 mln.
-18.94%
1 janv. 2000
54.9 mln.
+33.42 mln.
155.59%
1 janv. 2001
70.13 mln.
+15.23 mln.
27.74%
1 janv. 2002
73.44 mln.
+3.31 mln.
4.72%
1 janv. 2003
53.65 mln.
-19.79 mln.
-26.95%
1 janv. 2004
84.5 mln.
+30.85 mln.
57.5%
1 janv. 2005
112.063 mln.
+27.563 mln.
32.62%
1 janv. 2006
176.37 mln.
+64.308 mln.
57.39%
1 janv. 2007
130.716 mln.
-45.654 mln.
-25.89%
1 janv. 2008
45.457 mln.
-85.26 mln.
-65.23%
1 janv. 2009
82.283 mln.
+36.826 mln.
81.01%
1 janv. 2010
51.02 mln.
-31.262 mln.
-37.99%
1 janv. 2011
75.658 mln.
+24.638 mln.
48.29%
1 janv. 2012
82.751 mln.
+7.092 mln.
9.37%
1 janv. 2013
43.632 mln.
-39.119 mln.
-47.27%
1 janv. 2014
49.501 mln.
+5.869 mln.
13.45%
1 janv. 2015
124.627 mln.
+75.125 mln.
151.76%
Classement des pays selon les statistiques actuelles par années


Commentaires: