30
/fr/
AIzaSyAYiBZKx7MnpbEhh9jyipgxe19OcubqV5w
April 1, 2024
141515
Greece
GRC
true
2
1
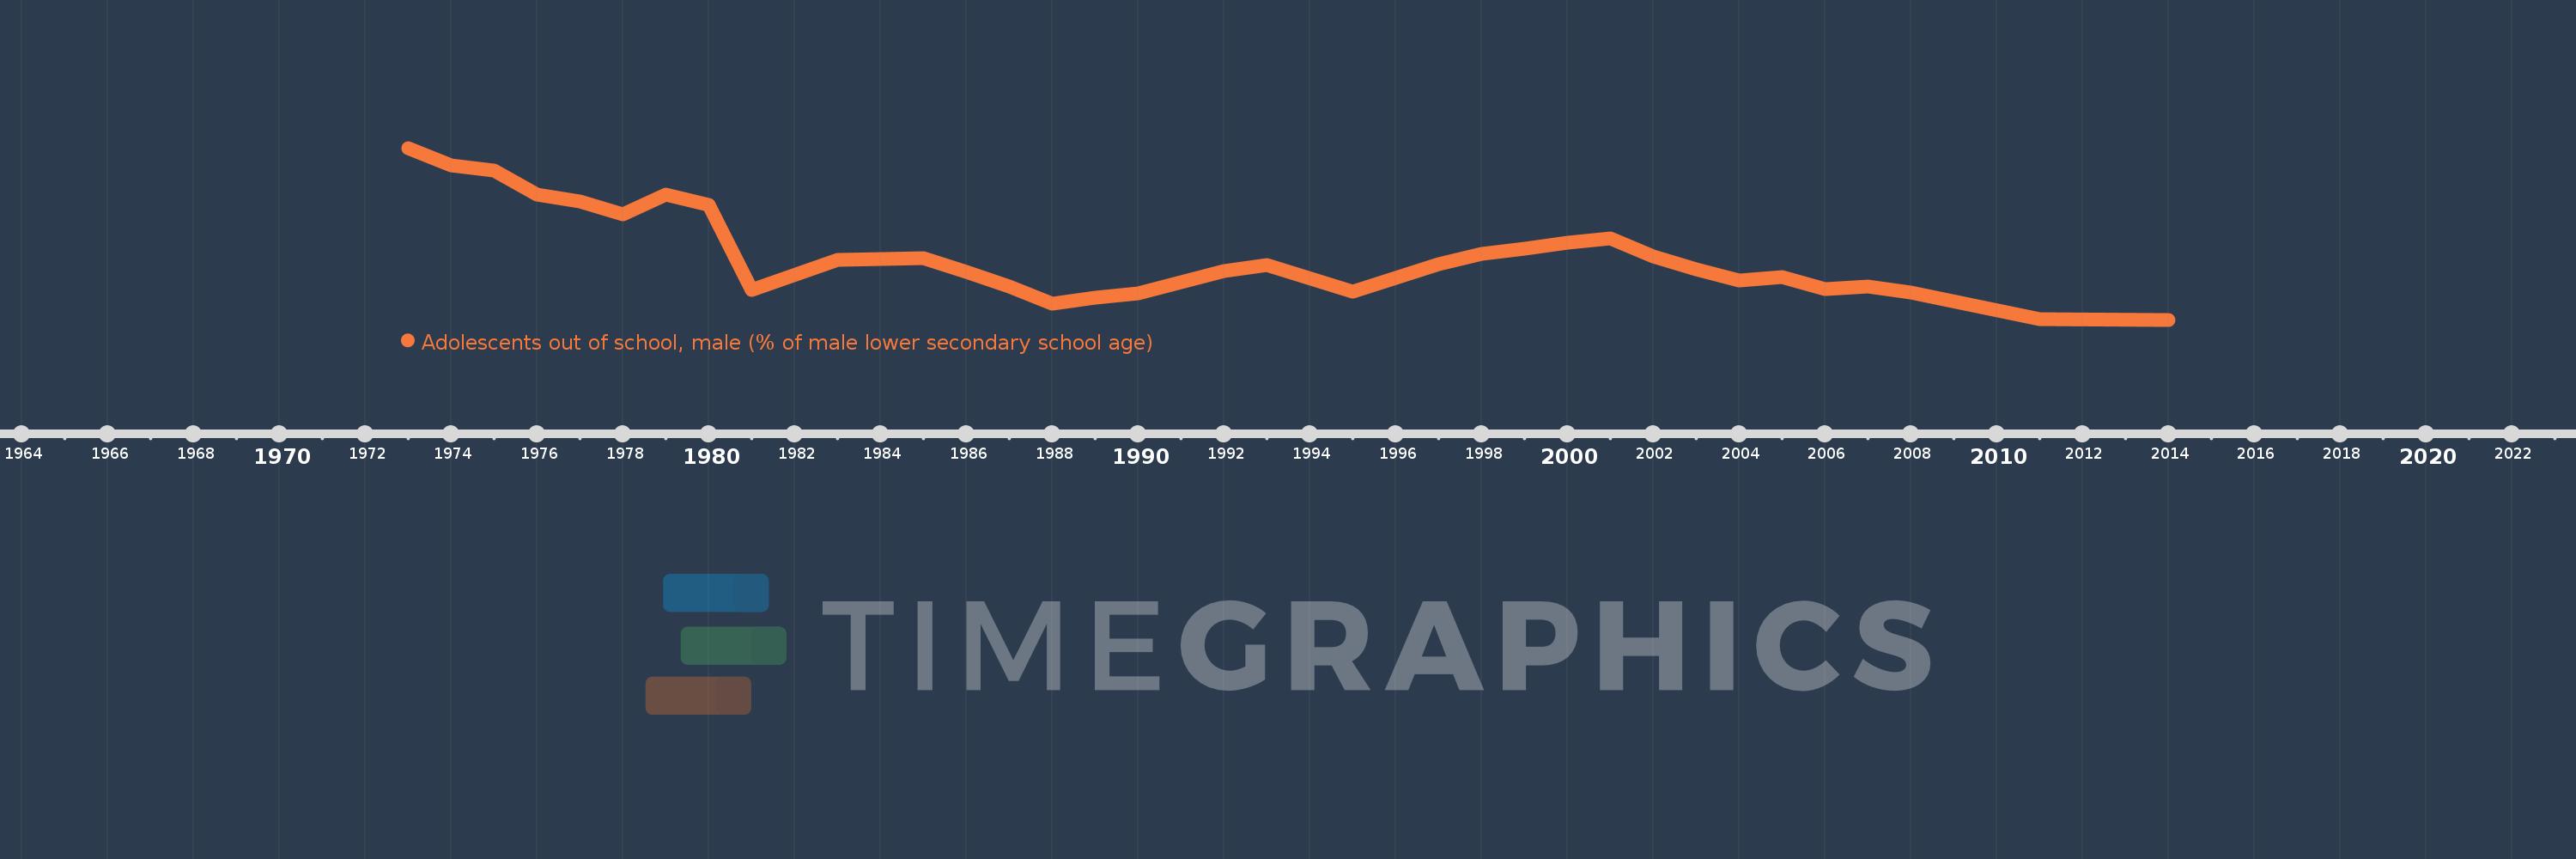
Adolescents out of school, male (% of male lower secondary school age)
2014,2011,2008,2007,2006,2005,2004,2003,2002,2001,2000,1999,1998,1997,1995,1993,1992,1990,1989,1988,1987,1986,1985,1983,1981,1980,1979,1978,1977,1976,1975,1974,1973
