29
/fr/
fr
AIzaSyAYiBZKx7MnpbEhh9jyipgxe19OcubqV5w
April 1, 2024
139126
Germany
DEU
true
2
1
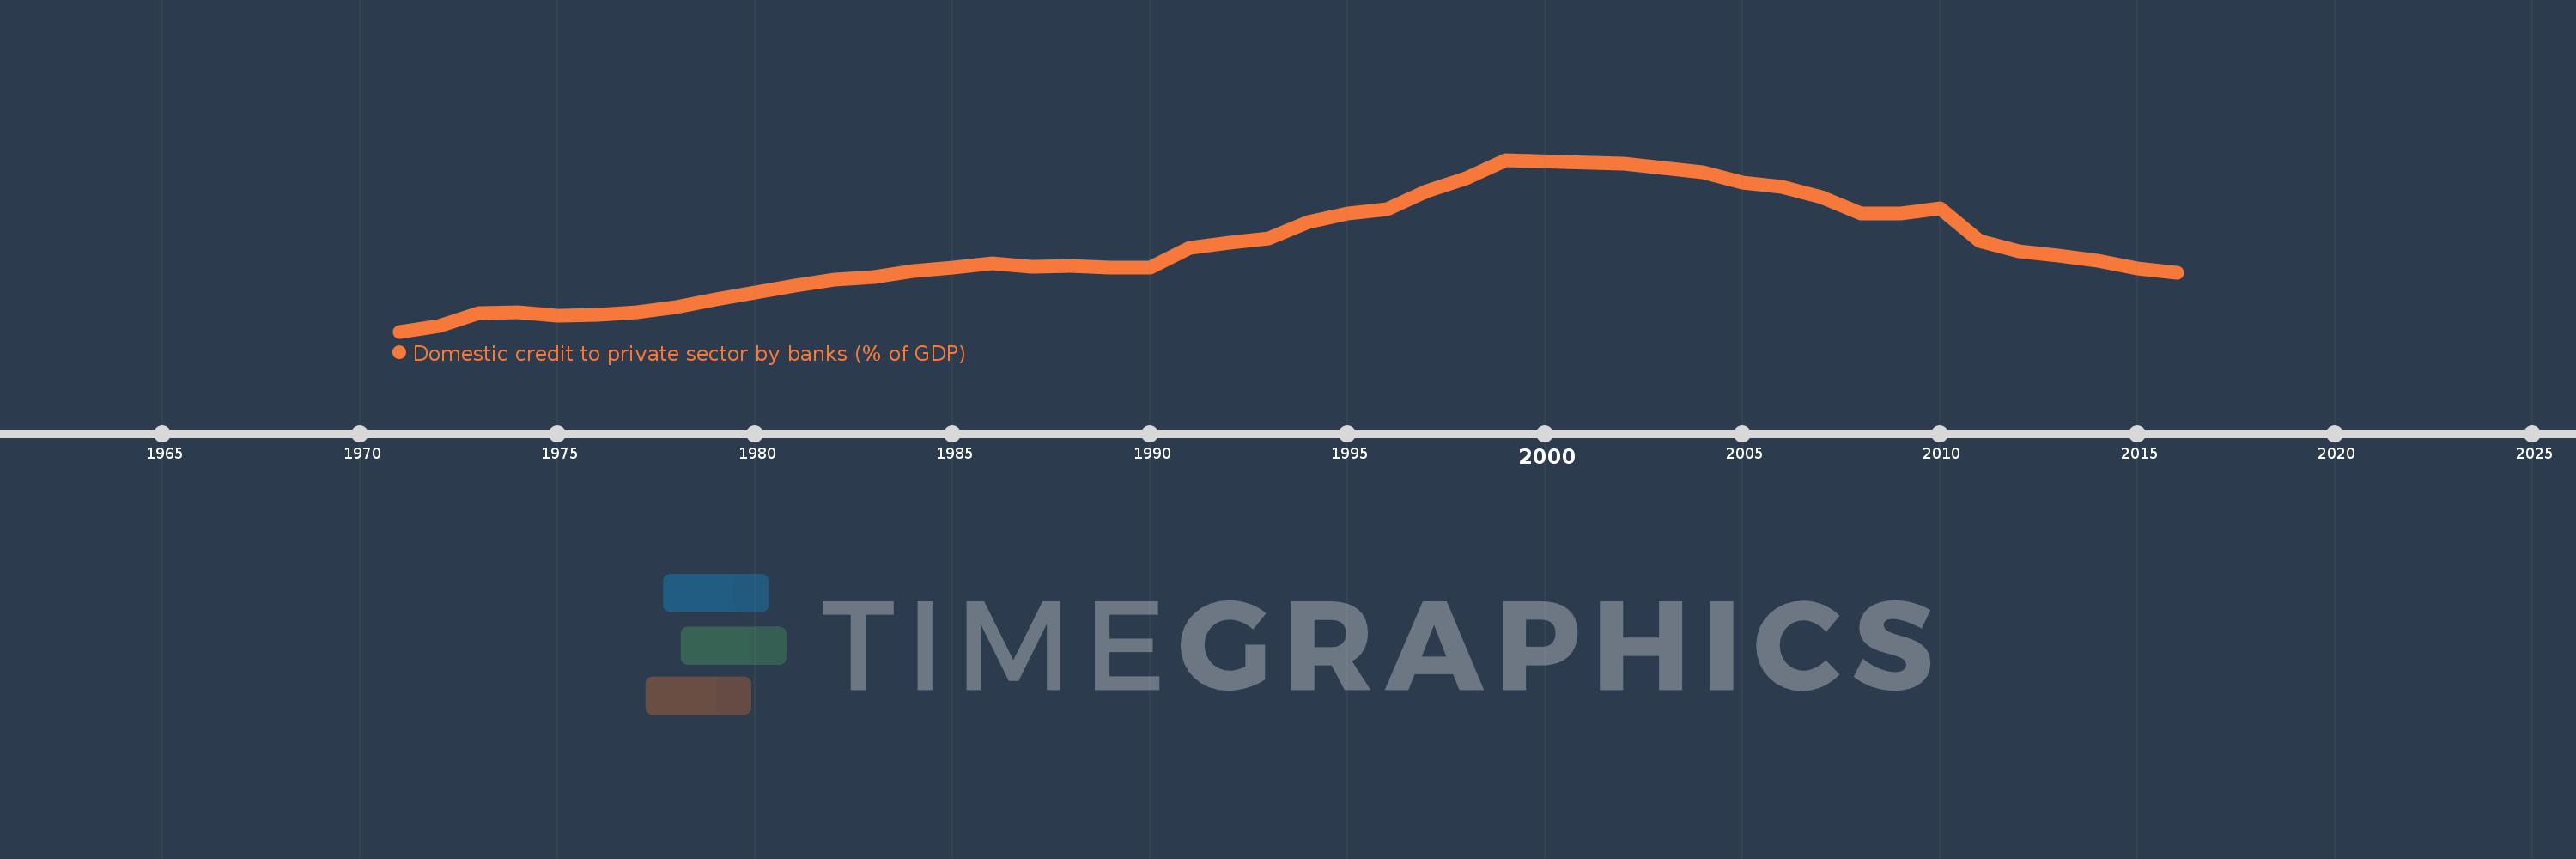
Domestic credit to private sector by banks (% of GDP)
2016,2015,2014,2013,2012,2011,2010,2009,2008,2007,2006,2005,2004,2003,2002,1999,1998,1997,1996,1995,1994,1993,1992,1991,1990,1989,1988,1987,1986,1985,1984,1983,1982,1981,1980,1979,1978,1977,1976,1975,1974,1973,1972,1971
Cette statistique dans les autres pays:
AfghanistanAlbaniaAlgeriaAngolaAntigua and BarbudaArab WorldArgentinaArmeniaArubaAustraliaAustriaAzerbaijanBahamas, TheBahrainBangladeshBarbadosBelarusBelgiumBelizeBeninBhutanBoliviaBosnia and HerzegovinaBotswanaBrazilBrunei DarussalamBulgariaBurkina FasoBurundiCabo VerdeCambodiaCameroonCanadaCaribbean small statesCentral African RepublicCentral Europe and the BalticsChadChileChinaColombiaComorosCongo, Dem. Rep.Congo, Rep.Costa RicaCote d'IvoireCroatiaCyprusCzech RepublicDenmarkDjiboutiDominicaDominican RepublicEarly-demographic dividendEast Asia & PacificEast Asia & Pacific (excluding high income)East Asia & Pacific (IDA & IBRD countries)EcuadorEgypt, Arab Rep.El SalvadorEquatorial GuineaEritreaEstoniaEthiopiaEuro areaEurope & Central AsiaEurope & Central Asia (excluding high income)Europe & Central Asia (IDA & IBRD countries)European UnionFijiFinlandFragile and conflict affected situationsFranceGabonGambia, TheGeorgiaGermanyGhanaGreeceGrenadaGuatemalaGuineaGuinea-BissauGuyanaHaitiHeavily indebted poor countries (HIPC)High incomeHondurasHong Kong SAR, ChinaHungaryIBRD onlyIcelandIDA & IBRD totalIDA blendIDA onlyIDA totalIndiaIndonesiaIran, Islamic Rep.IraqIrelandIsraelItalyJamaicaJapanJordanKazakhstanKenyaKorea, Rep.KosovoKuwaitKyrgyz RepublicLao PDRLate-demographic dividendLatin America & Caribbean Latin America & Caribbean (excluding high income)Latin America & the Caribbean (IDA & IBRD countries)LatviaLeast developed countries: UN classificationLebanonLesothoLiberiaLibyaLithuaniaLow & middle incomeLow incomeLower middle incomeLuxembourgMacao SAR, ChinaMacedonia, FYRMadagascarMalawiMalaysiaMaldivesMaliMaltaMauritaniaMauritiusMexicoMicronesia, Fed. Sts.Middle East & North AfricaMiddle East & North Africa (excluding high income)Middle East & North Africa (IDA & IBRD countries)Middle incomeMoldovaMongoliaMontenegroMoroccoMozambiqueMyanmarNamibiaNepalNetherlandsNew ZealandNicaraguaNigerNigeriaNorth AmericaNorwayOECD membersOmanOther small statesPacific island small statesPakistanPanamaPapua New GuineaParaguayPeruPhilippinesPolandPortugalPost-demographic dividendPre-demographic dividendQatarRomaniaRussian FederationRwandaSamoaSao Tome and PrincipeSaudi ArabiaSenegalSerbiaSeychellesSierra LeoneSingaporeSlovak RepublicSloveniaSmall statesSolomon IslandsSouth AfricaSouth AsiaSouth Asia (IDA & IBRD)South SudanSpainSri LankaSt. Kitts and NevisSt. LuciaSt. Vincent and the GrenadinesSub-Saharan Africa Sub-Saharan Africa (excluding high income)Sub-Saharan Africa (IDA & IBRD countries)SudanSurinameSwazilandSwedenSwitzerlandSyrian Arab RepublicTajikistanTanzaniaThailandTimor-LesteTogoTongaTrinidad and TobagoTunisiaTurkeyUgandaUkraineUnited Arab EmiratesUnited KingdomUnited StatesUpper middle incomeUruguayVanuatuVenezuela, RBVietnamWest Bank and GazaWorldYemen, Rep.ZambiaZimbabwe La ligne de temps
Cette échelle de temps montre un graphique de 1971 année à 2016 année Germany. Les données jusqu'à 1970 année ne sont pas présentés. Quantité d'observations actuelles selon dates: 44.
Source (désignation):
Les indicateurs du développement mondiale
Source (organisation):
International Monetary Fund, International Financial Statistics and data files, and World Bank and OECD GDP estimates.
Catégories:
Financial Sector
Dernière mise à jour
23 avr. 2017
Les indicateurs de changement de valeurs selon les années
Minimum:
59.597
1 janv. 1971
Maximum:
113.289
1 janv. 1999
Pour la date d''observation
Valeur
Changement absolu
Le changement par rapport à la valeur précédente
1 janv. 1971
59.597
+59.597
0.0%
1 janv. 1972
61.355
+1.758
2.95%
1 janv. 1973
65.281
+3.926
6.4%
1 janv. 1974
65.506
+0.225
0.34%
1 janv. 1975
64.643
-0.863
-1.32%
1 janv. 1976
64.867
+0.223
0.35%
1 janv. 1977
65.519
+0.653
1.01%
1 janv. 1978
67.242
+1.723
2.63%
1 janv. 1979
69.589
+2.347
3.49%
1 janv. 1980
71.924
+2.335
3.36%
1 janv. 1981
73.855
+1.931
2.68%
1 janv. 1982
75.775
+1.92
2.6%
1 janv. 1983
76.677
+0.902
1.19%
1 janv. 1984
78.485
+1.808
2.36%
1 janv. 1985
79.485
+0.999
1.27%
1 janv. 1986
81.012
+1.528
1.92%
1 janv. 1987
79.908
-1.104
-1.36%
1 janv. 1988
80.253
+0.345
0.43%
1 janv. 1989
79.551
-0.703
-0.88%
1 janv. 1990
79.52
-0.031
-0.04%
1 janv. 1991
85.777
+6.257
7.87%
1 janv. 1992
87.372
+1.595
1.86%
1 janv. 1993
88.64
+1.268
1.45%
1 janv. 1994
93.759
+5.119
5.78%
1 janv. 1995
96.415
+2.656
2.83%
1 janv. 1996
97.76
+1.345
1.4%
1 janv. 1997
103.519
+5.758
5.89%
1 janv. 1998
107.546
+4.028
3.89%
1 janv. 1999
113.289
+5.743
5.34%
1 janv. 2002
112.04
-1.249
-1.1%
1 janv. 2003
110.867
-1.173
-1.05%
1 janv. 2004
109.519
-1.348
-1.22%
1 janv. 2005
106.062
-3.457
-3.16%
1 janv. 2006
104.874
-1.188
-1.12%
1 janv. 2007
101.722
-3.152
-3.01%
1 janv. 2008
96.6
-5.122
-5.04%
1 janv. 2009
96.427
-0.173
-0.18%
1 janv. 2010
98.186
+1.758
1.82%
1 janv. 2011
87.954
-10.232
-10.42%
1 janv. 2012
84.598
-3.356
-3.82%
1 janv. 2013
83.414
-1.184
-1.4%
1 janv. 2014
81.658
-1.755
-2.1%
1 janv. 2015
79.402
-2.256
-2.76%
1 janv. 2016
77.944
-1.459
-1.84%
Classement des pays selon les statistiques actuelles par années


Commentaires: