29
/fr/
fr
AIzaSyAYiBZKx7MnpbEhh9jyipgxe19OcubqV5w
April 1, 2024
137388
Gambia, The
GMB
true
2
1
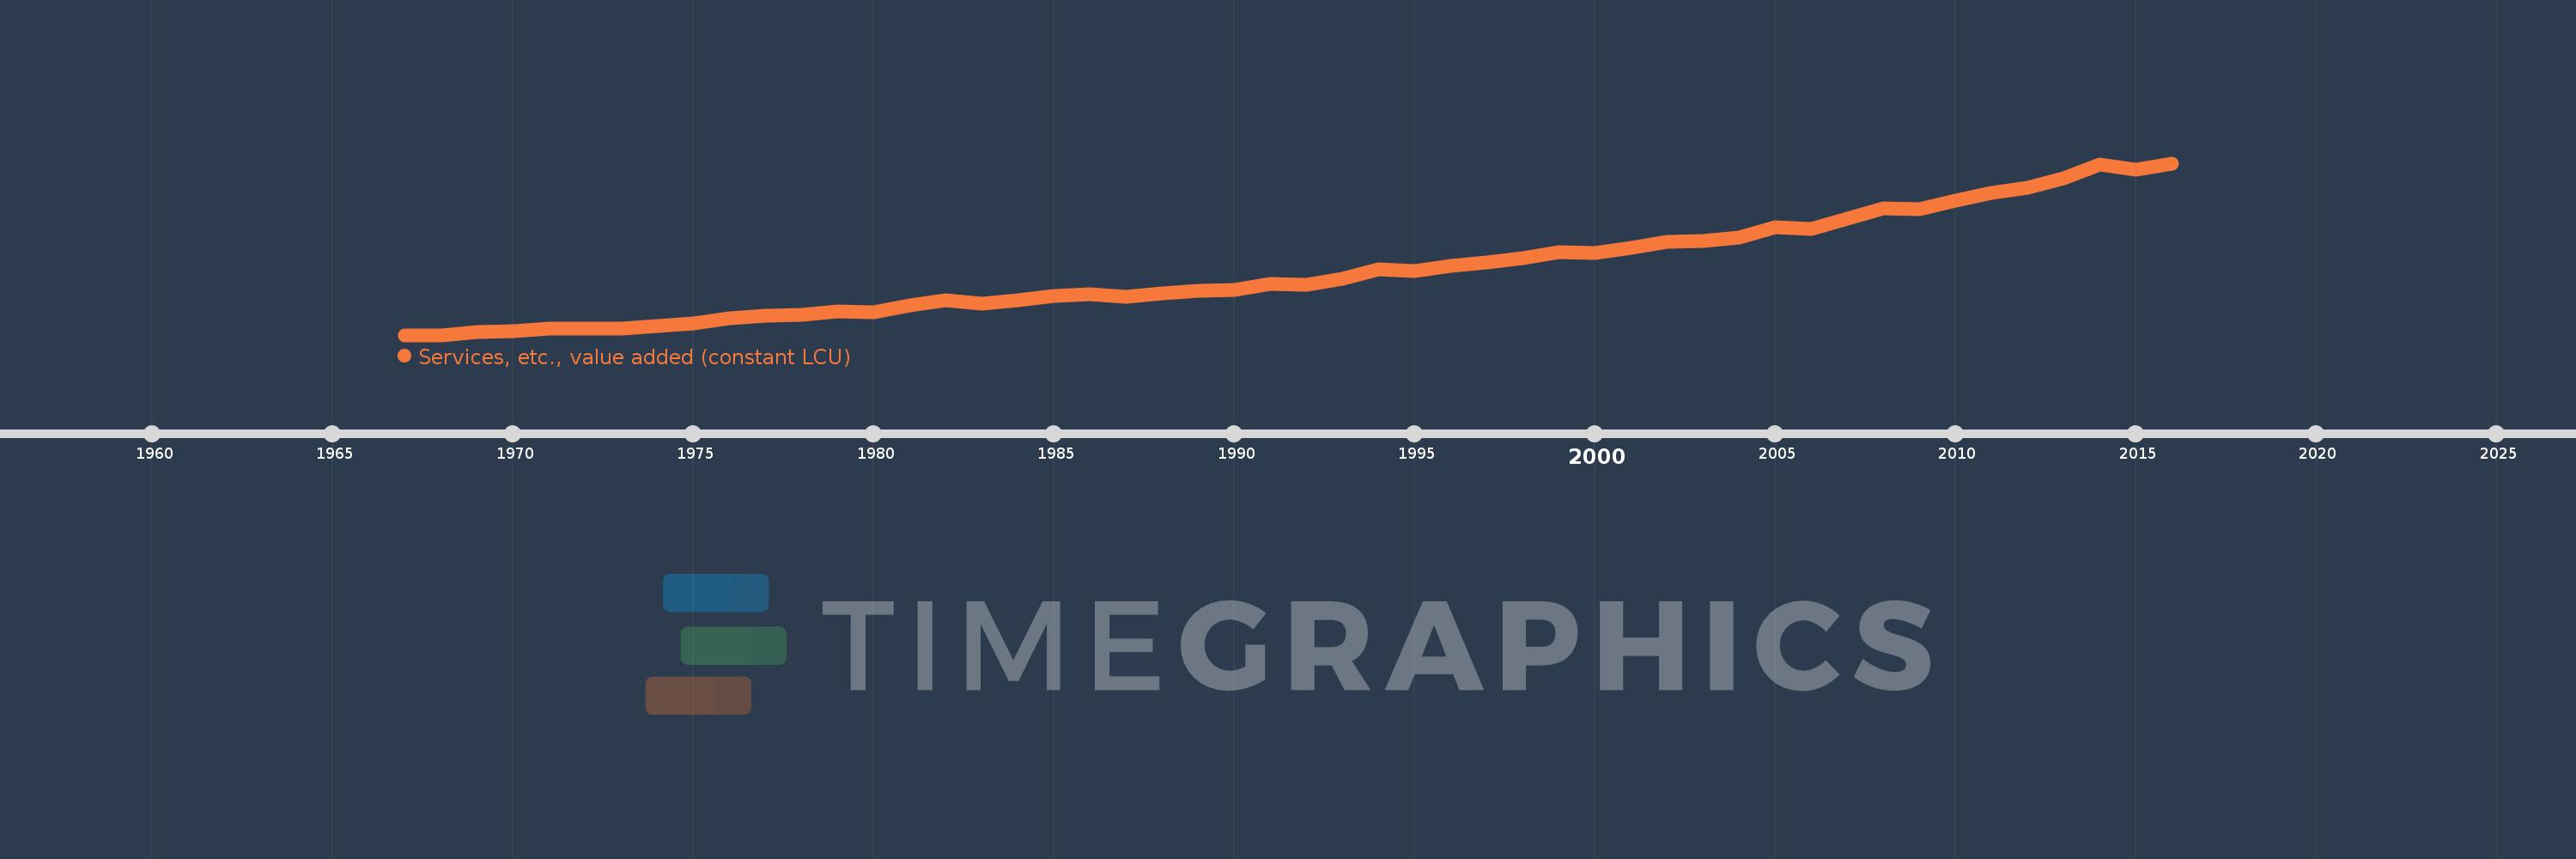
Services, etc., value added (constant LCU)
2016,2015,2014,2013,2012,2011,2010,2009,2008,2007,2006,2005,2004,2003,2002,2001,2000,1999,1998,1997,1996,1995,1994,1993,1992,1991,1990,1989,1988,1987,1986,1985,1984,1983,1982,1981,1980,1979,1978,1977,1976,1975,1974,1973,1972,1971,1970,1969,1968,1967
Cette statistique dans les autres pays:
AfghanistanAlbaniaAlgeriaAntigua and BarbudaArgentinaArmeniaAustraliaAustriaAzerbaijanBahamas, TheBahrainBangladeshBelarusBelgiumBelizeBeninBermudaBhutanBoliviaBosnia and HerzegovinaBotswanaBrazilBrunei DarussalamBulgariaBurkina FasoBurundiCabo VerdeCambodiaCameroonCanadaCentral African RepublicChadChileChinaColombiaComorosCongo, Dem. Rep.Congo, Rep.Costa RicaCote d'IvoireCroatiaCubaCyprusCzech RepublicDenmarkDjiboutiDominicaDominican RepublicEcuadorEgypt, Arab Rep.El SalvadorEquatorial GuineaEritreaEstoniaEthiopiaFijiFinlandFranceGabonGambia, TheGeorgiaGermanyGhanaGreeceGrenadaGuatemalaGuineaGuinea-BissauGuyanaHaitiHondurasHong Kong SAR, ChinaHungaryIcelandIndiaIndonesiaIran, Islamic Rep.IraqIrelandItalyJamaicaJapanJordanKazakhstanKenyaKiribatiKorea, Rep.KosovoKuwaitKyrgyz RepublicLao PDRLatviaLebanonLesothoLiberiaLithuaniaLuxembourgMacedonia, FYRMadagascarMalawiMalaysiaMaldivesMaliMarshall IslandsMauritaniaMauritiusMexicoMicronesia, Fed. Sts.MoldovaMongoliaMontenegroMoroccoMozambiqueMyanmarNamibiaNepalNetherlandsNew ZealandNicaraguaNigerNigeriaNorwayOmanPakistanPalauPanamaPapua New GuineaParaguayPeruPhilippinesPolandPortugalPuerto RicoQatarRomaniaRussian FederationRwandaSamoaSao Tome and PrincipeSaudi ArabiaSenegalSerbiaSeychellesSierra LeoneSingaporeSlovak RepublicSloveniaSolomon IslandsSomaliaSouth AfricaSpainSri LankaSt. Kitts and NevisSt. LuciaSt. Vincent and the GrenadinesSudanSurinameSwazilandSwedenSwitzerlandSyrian Arab RepublicTajikistanTanzaniaThailandTimor-LesteTogoTongaTrinidad and TobagoTunisiaTurkeyTurkmenistanTuvaluUgandaUkraineUnited Arab EmiratesUnited KingdomUnited StatesUruguayUzbekistanVanuatuVenezuela, RBVietnamWest Bank and GazaZambiaZimbabwe La ligne de temps
Cette échelle de temps montre un graphique de 1967 année à 2016 année Gambia, The. Les données jusqu'à 1966 année ne sont pas présentés. Quantité d'observations actuelles selon dates: 50.
Source (désignation):
Les indicateurs du développement mondiale
Source (organisation):
World Bank national accounts data, and OECD National Accounts data files.
Catégories:
Economy & Growth
Dernière mise à jour
23 avr. 2017
Les indicateurs de changement de valeurs selon les années
Minimum:
2.245 mds
1 janv. 1967
Maximum:
15.165 mds
1 janv. 2016
Pour la date d''observation
Valeur
Changement absolu
Le changement par rapport à la valeur précédente
1 janv. 1967
2.245 mds
+2.245 mds
0.0%
1 janv. 1968
2.245 mds
0.0
0.0%
1 janv. 1969
2.484 mds
+238.83 mln.
10.64%
1 janv. 1970
2.544 mds
+60.299 mln.
2.43%
1 janv. 1971
2.698 mds
+153.703 mln.
6.04%
1 janv. 1972
2.698 mds
0.0
0.0%
1 janv. 1973
2.705 mds
+7.094 mln.
0.26%
1 janv. 1974
2.953 mds
+248.289 mln.
9.18%
1 janv. 1975
3.127 mds
+173.802 mln.
5.88%
1 janv. 1976
3.515 mds
+387.804 mln.
12.4%
1 janv. 1977
3.714 mds
+198.631 mln.
5.65%
1 janv. 1978
3.781 mds
+67.393 mln.
1.81%
1 janv. 1979
4.01 mds
+229.371 mln.
6.07%
1 janv. 1980
3.967 mds
-43.746 mln.
-1.09%
1 janv. 1981
4.477 mds
+510.529 mln.
12.87%
1 janv. 1982
4.83 mds
+352.57 mln.
7.87%
1 janv. 1983
4.574 mds
-255.501 mln.
-5.29%
1 janv. 1984
4.839 mds
+265.078 mln.
5.79%
1 janv. 1985
5.171 mds
+331.525 mln.
6.85%
1 janv. 1986
5.287 mds
+116.578 mln.
2.25%
1 janv. 1987
5.096 mds
-191.359 mln.
-3.62%
1 janv. 1988
5.406 mds
+309.473 mln.
6.07%
1 janv. 1989
5.557 mds
+151.01 mln.
2.79%
1 janv. 1990
5.664 mds
+107.6 mln.
1.94%
1 janv. 1991
6.079 mds
+414.343 mln.
7.32%
1 janv. 1992
6.036 mds
-42.781 mln.
-0.7%
1 janv. 1993
6.454 mds
+418.171 mln.
6.93%
1 janv. 1994
7.177 mds
+722.78 mln.
11.2%
1 janv. 1995
7.045 mds
-132.03 mln.
-1.84%
1 janv. 1996
7.457 mds
+412.033 mln.
5.85%
1 janv. 1997
7.69 mds
+233.094 mln.
3.13%
1 janv. 1998
8.015 mds
+325.491 mln.
4.23%
1 janv. 1999
8.466 mds
+450.253 mln.
5.62%
1 janv. 2000
8.407 mds
-58.26 mln.
-0.69%
1 janv. 2001
8.834 mds
+426.502 mln.
5.07%
1 janv. 2002
9.237 mds
+403.024 mln.
4.56%
1 janv. 2003
9.313 mds
+76.442 mln.
0.83%
1 janv. 2004
9.588 mds
+274.604 mln.
2.95%
1 janv. 2005
10.357 mds
+769.564 mln.
8.03%
1 janv. 2006
10.246 mds
-111.152 mln.
-1.07%
1 janv. 2007
11.019 mds
+772.949 mln.
7.54%
1 janv. 2008
11.744 mds
+724.619 mln.
6.58%
1 janv. 2009
11.713 mds
-30.81 mln.
-0.26%
1 janv. 2010
12.345 mds
+632.29 mln.
5.4%
1 janv. 2011
12.945 mds
+600.1 mln.
4.86%
1 janv. 2012
13.311 mds
+365.725 mln.
2.83%
1 janv. 2013
14.061 mds
+750.327 mln.
5.64%
1 janv. 2014
15.059 mds
+997.205 mln.
7.09%
1 janv. 2015
14.683 mds
-375.406 mln.
-2.49%
1 janv. 2016
15.165 mds
+481.495 mln.
3.28%
Classement des pays selon les statistiques actuelles par années


Commentaires: