29
/fr/
fr
AIzaSyAYiBZKx7MnpbEhh9jyipgxe19OcubqV5w
April 1, 2024
137122
Gambia, The
GMB
true
2
1
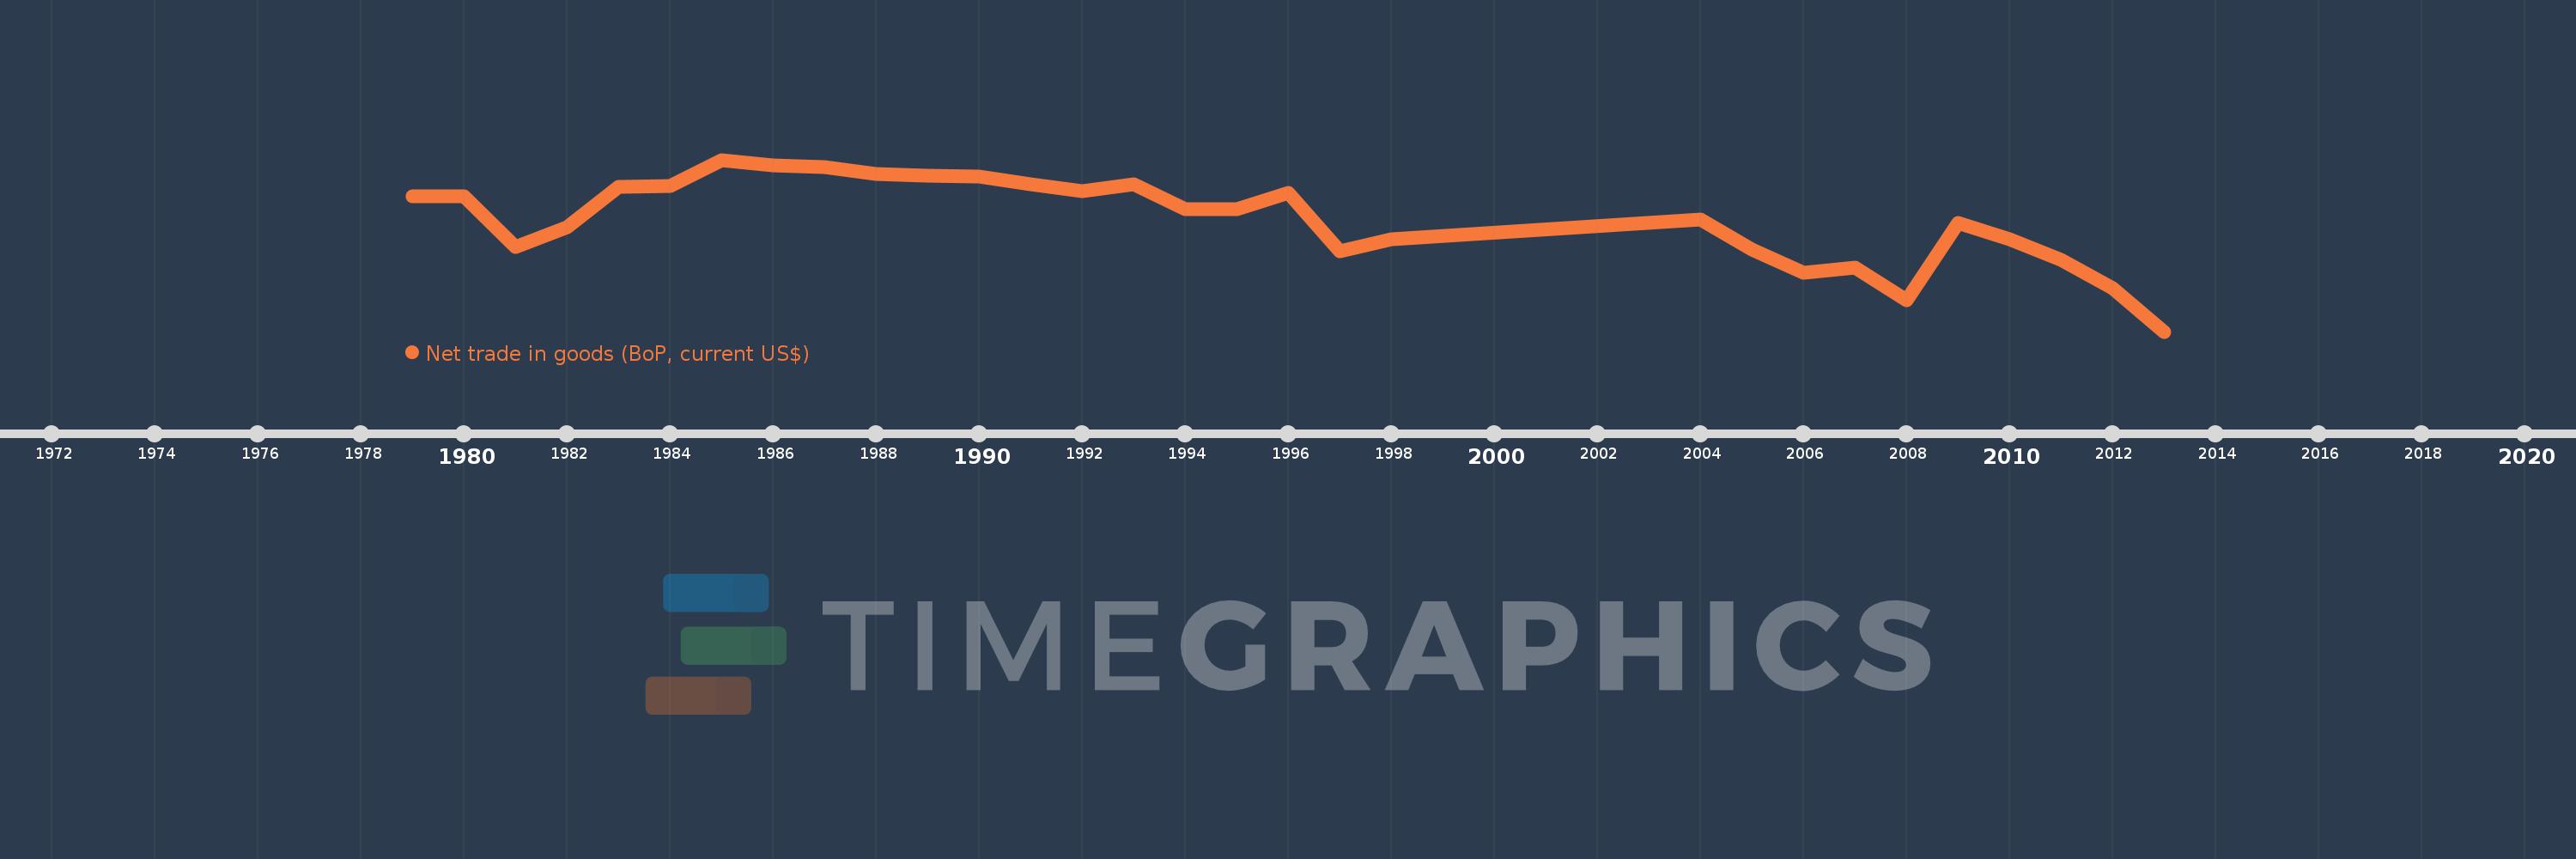
Net trade in goods (BoP, current US$)
2013,2012,2011,2010,2009,2008,2007,2006,2005,2004,1998,1997,1996,1995,1994,1993,1992,1991,1990,1989,1988,1987,1986,1985,1984,1983,1982,1981,1980,1979
Cette statistique dans les autres pays:
AfghanistanAlbaniaAlgeriaAngolaAntigua and BarbudaArgentinaArmeniaArubaAustraliaAustriaAzerbaijanBahamas, TheBahrainBangladeshBarbadosBelarusBelgiumBelizeBeninBermudaBhutanBoliviaBosnia and HerzegovinaBotswanaBrazilBrunei DarussalamBulgariaBurkina FasoBurundiCabo VerdeCambodiaCameroonCanadaCentral African RepublicChadChileChinaColombiaComorosCongo, Dem. Rep.Congo, Rep.Costa RicaCote d'IvoireCroatiaCuracaoCyprusCzech RepublicDenmarkDjiboutiDominicaDominican RepublicEcuadorEgypt, Arab Rep.El SalvadorEquatorial GuineaEritreaEstoniaEthiopiaEuro areaFaroe IslandsFijiFinlandFranceFrench PolynesiaGabonGambia, TheGeorgiaGermanyGhanaGreeceGrenadaGuatemalaGuineaGuinea-BissauGuyanaHaitiHondurasHong Kong SAR, ChinaHungaryIcelandIndiaIndonesiaIran, Islamic Rep.IraqIrelandIsraelItalyJamaicaJapanJordanKazakhstanKenyaKiribatiKorea, Rep.KosovoKuwaitKyrgyz RepublicLao PDRLatviaLebanonLesothoLiberiaLibyaLithuaniaLuxembourgMacao SAR, ChinaMacedonia, FYRMadagascarMalawiMalaysiaMaldivesMaliMaltaMarshall IslandsMauritaniaMauritiusMexicoMicronesia, Fed. Sts.MoldovaMongoliaMontenegroMoroccoMozambiqueMyanmarNamibiaNepalNetherlandsNew CaledoniaNew ZealandNicaraguaNigerNigeriaNorwayOmanPakistanPalauPanamaPapua New GuineaParaguayPeruPhilippinesPolandPortugalQatarRomaniaRussian FederationRwandaSamoaSao Tome and PrincipeSaudi ArabiaSenegalSerbiaSeychellesSierra LeoneSingaporeSint Maarten (Dutch part)Slovak RepublicSloveniaSolomon IslandsSouth AfricaSouth SudanSpainSri LankaSt. Kitts and NevisSt. LuciaSt. Vincent and the GrenadinesSudanSurinameSwazilandSwedenSwitzerlandSyrian Arab RepublicTajikistanTanzaniaThailandTimor-LesteTogoTongaTrinidad and TobagoTunisiaTurkeyTuvaluUgandaUkraineUnited KingdomUnited StatesUruguayVanuatuVenezuela, RBVietnamWest Bank and GazaYemen, Rep.ZambiaZimbabwe La ligne de temps
Cette échelle de temps montre un graphique de 1979 année à 2013 année Gambia, The. Les données jusqu'à 1978 année ne sont pas présentés. Quantité d'observations actuelles selon dates: 30.
Source (désignation):
Les indicateurs du développement mondiale
Source (organisation):
International Monetary Fund, Balance of Payments Statistics Yearbook and data files.
Catégories:
Economy & Growth, Trade
Dernière mise à jour
23 avr. 2017
Les indicateurs de changement de valeurs selon les années
Minimum:
-176.382 mln.
1 janv. 2013
Maximum:
-7.129 mln.
1 janv. 1985
Pour la date d''observation
Valeur
Changement absolu
Le changement par rapport à la valeur précédente
1 janv. 1979
-43.001 mln.
-43.001 mln.
0.0%
1 janv. 1980
-43.386 mln.
-384.157 milles
0.89%
1 janv. 1981
-93.15 mln.
-49.765 mln.
114.7%
1 janv. 1982
-73.642 mln.
+19.508 mln.
-20.94%
1 janv. 1983
-34.125 mln.
+39.517 mln.
-53.66%
1 janv. 1984
-33.063 mln.
+1.062 mln.
-3.11%
1 janv. 1985
-7.129 mln.
+25.935 mln.
-78.44%
1 janv. 1986
-12.705 mln.
-5.576 mln.
78.21%
1 janv. 1987
-14.189 mln.
-1.485 mln.
11.69%
1 janv. 1988
-21.1 mln.
-6.911 mln.
48.7%
1 janv. 1989
-22.999 mln.
-1.899 mln.
9.0%
1 janv. 1990
-23.332 mln.
-332.536 milles
1.45%
1 janv. 1991
-30.842 mln.
-7.51 mln.
32.19%
1 janv. 1992
-38.31 mln.
-7.469 mln.
24.22%
1 janv. 1993
-31.644 mln.
+6.666 mln.
-17.4%
1 janv. 1994
-55.747 mln.
-24.102 mln.
76.17%
1 janv. 1995
-56.127 mln.
-380.581 milles
0.68%
1 janv. 1996
-39.3 mln.
+16.827 mln.
-29.98%
1 janv. 1997
-97.07 mln.
-57.77 mln.
147.0%
1 janv. 1998
-85.224 mln.
+11.846 mln.
-12.2%
1 janv. 2004
-65.693 mln.
+19.532 mln.
-22.92%
1 janv. 2005
-95.966 mln.
-30.273 mln.
46.08%
1 janv. 2006
-118.283 mln.
-22.317 mln.
23.26%
1 janv. 2007
-113.351 mln.
+4.932 mln.
-4.17%
1 janv. 2008
-145.239 mln.
-31.888 mln.
28.13%
1 janv. 2009
-69.052 mln.
+76.188 mln.
-52.46%
1 janv. 2010
-85.752 mln.
-16.701 mln.
24.19%
1 janv. 2011
-105.839 mln.
-20.087 mln.
23.42%
1 janv. 2012
-133.458 mln.
-27.619 mln.
26.1%
1 janv. 2013
-176.382 mln.
-42.924 mln.
32.16%
Classement des pays selon les statistiques actuelles par années


Commentaires: