29
/fr/
fr
AIzaSyAYiBZKx7MnpbEhh9jyipgxe19OcubqV5w
April 1, 2024
134592
France
FRA
true
2
1
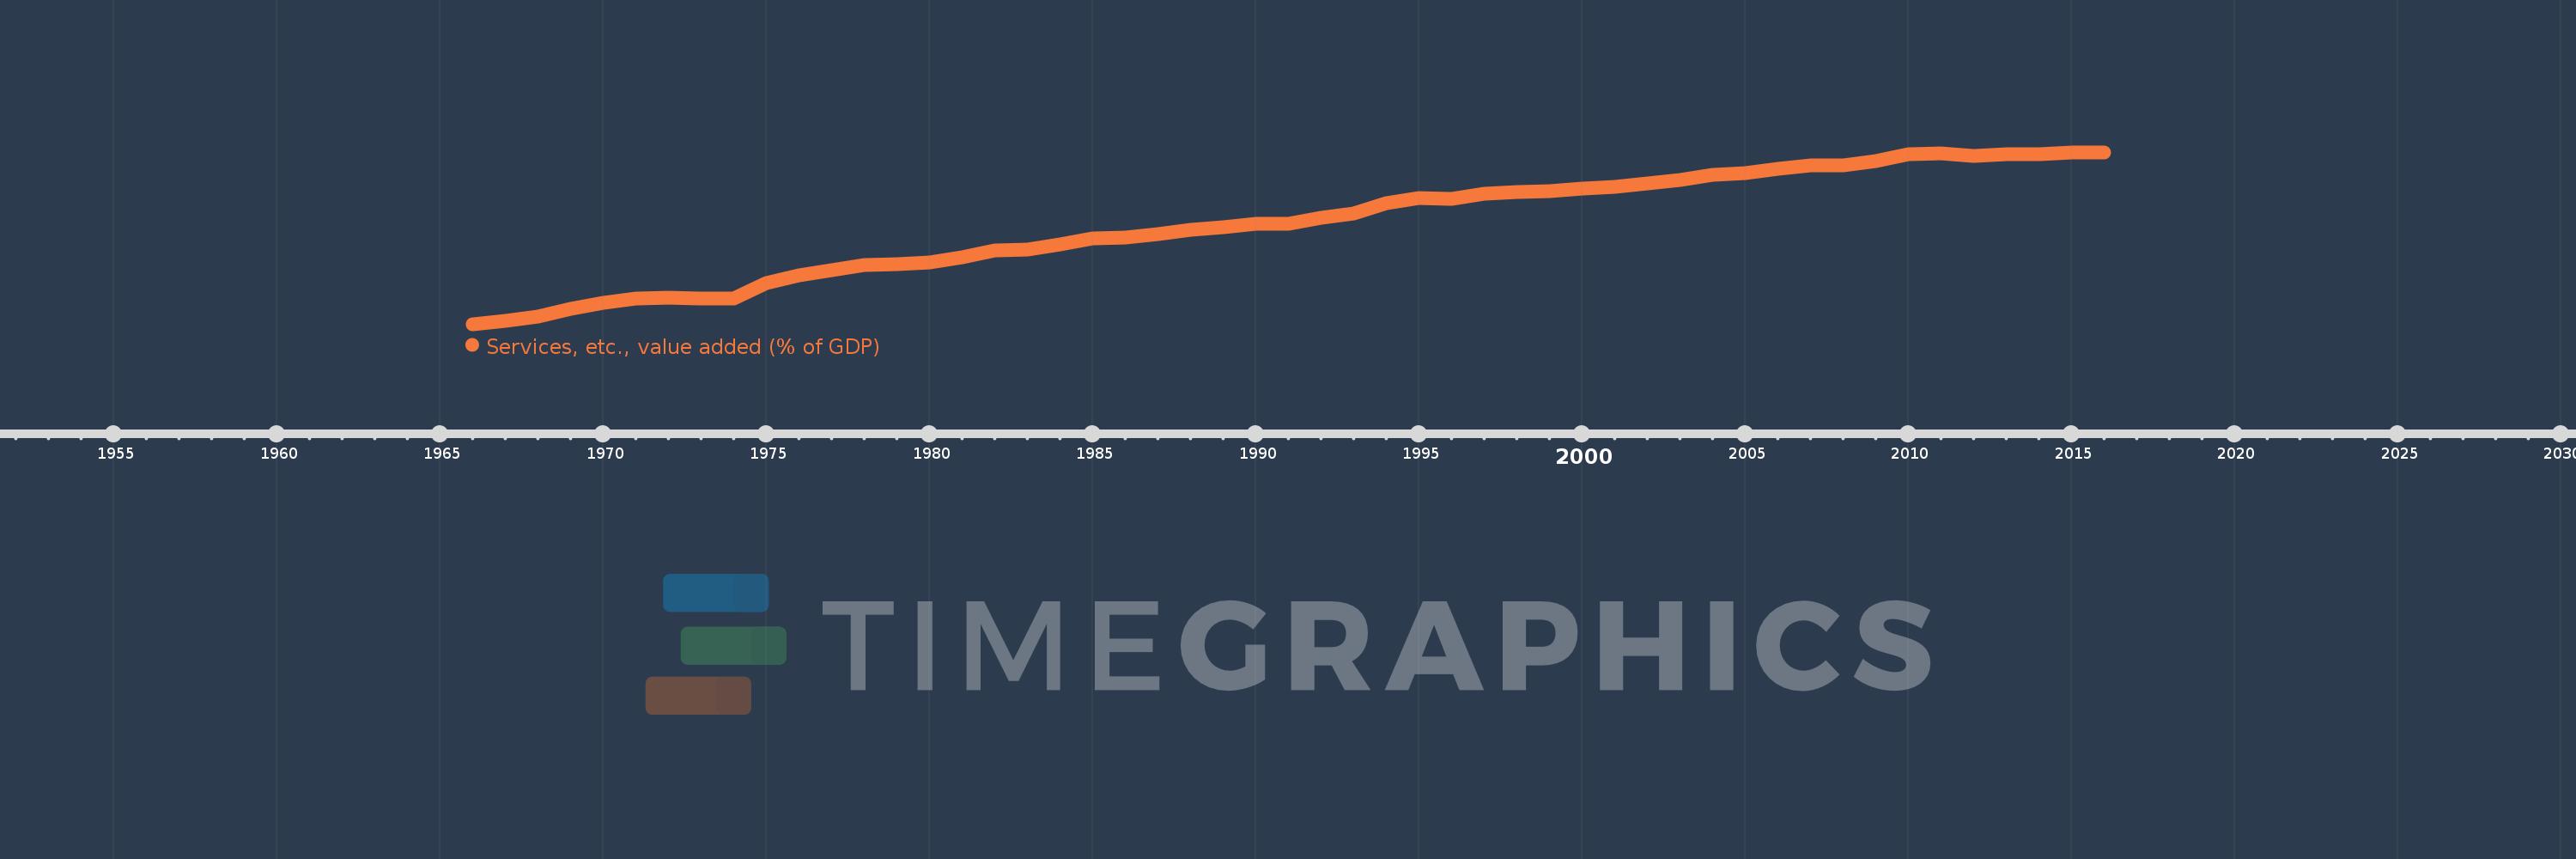
Services, etc., value added (% of GDP)
2016,2015,2014,2013,2012,2011,2010,2009,2008,2007,2006,2005,2004,2003,2002,2001,2000,1999,1998,1997,1996,1995,1994,1993,1992,1991,1990,1989,1988,1987,1986,1985,1984,1983,1982,1981,1980,1979,1978,1977,1976,1975,1974,1973,1972,1971,1970,1969,1968,1967,1966
Cette statistique dans les autres pays:
AfghanistanAlbaniaAlgeriaAndorraAngolaAntigua and BarbudaArab WorldArgentinaArmeniaArubaAustraliaAustriaAzerbaijanBahamas, TheBahrainBangladeshBarbadosBelarusBelgiumBelizeBeninBermudaBhutanBoliviaBosnia and HerzegovinaBotswanaBrazilBrunei DarussalamBulgariaBurkina FasoBurundiCabo VerdeCambodiaCameroonCanadaCaribbean small statesCentral African RepublicCentral Europe and the BalticsChadChileChinaColombiaComorosCongo, Dem. Rep.Congo, Rep.Costa RicaCote d'IvoireCroatiaCubaCyprusCzech RepublicDenmarkDjiboutiDominicaDominican RepublicEarly-demographic dividendEast Asia & PacificEast Asia & Pacific (excluding high income)East Asia & Pacific (IDA & IBRD countries)EcuadorEgypt, Arab Rep.El SalvadorEquatorial GuineaEritreaEstoniaEthiopiaEuro areaEurope & Central AsiaEurope & Central Asia (excluding high income)Europe & Central Asia (IDA & IBRD countries)European UnionFaroe IslandsFijiFinlandFragile and conflict affected situationsFranceGabonGambia, TheGeorgiaGermanyGhanaGreeceGrenadaGuatemalaGuineaGuinea-BissauGuyanaHeavily indebted poor countries (HIPC)High incomeHondurasHong Kong SAR, ChinaHungaryIBRD onlyIcelandIDA & IBRD totalIDA blendIDA onlyIDA totalIndiaIndonesiaIran, Islamic Rep.IrelandItalyJamaicaJapanJordanKazakhstanKenyaKiribatiKorea, Rep.KosovoKuwaitKyrgyz RepublicLao PDRLate-demographic dividendLatin America & Caribbean Latin America & Caribbean (excluding high income)Latin America & the Caribbean (IDA & IBRD countries)LatviaLeast developed countries: UN classificationLebanonLesothoLibyaLithuaniaLow & middle incomeLow incomeLower middle incomeLuxembourgMacao SAR, ChinaMacedonia, FYRMadagascarMalawiMalaysiaMaldivesMaliMaltaMarshall IslandsMauritaniaMauritiusMexicoMicronesia, Fed. Sts.Middle East & North AfricaMiddle East & North Africa (excluding high income)Middle East & North Africa (IDA & IBRD countries)Middle incomeMoldovaMongoliaMontenegroMoroccoMozambiqueMyanmarNamibiaNepalNetherlandsNew CaledoniaNew ZealandNicaraguaNigerNigeriaNorth AmericaNorwayOECD membersOmanOther small statesPacific island small statesPakistanPalauPanamaPapua New GuineaParaguayPeruPhilippinesPolandPortugalPost-demographic dividendPre-demographic dividendPuerto RicoQatarRomaniaRussian FederationRwandaSao Tome and PrincipeSaudi ArabiaSenegalSerbiaSeychellesSierra LeoneSingaporeSlovak RepublicSloveniaSmall statesSolomon IslandsSomaliaSouth AfricaSouth AsiaSouth Asia (IDA & IBRD)SpainSri LankaSt. Kitts and NevisSt. LuciaSt. Vincent and the GrenadinesSub-Saharan Africa Sub-Saharan Africa (excluding high income)Sub-Saharan Africa (IDA & IBRD countries)SudanSurinameSwazilandSwedenSwitzerlandSyrian Arab RepublicTajikistanTanzaniaThailandTimor-LesteTogoTongaTrinidad and TobagoTunisiaTurkeyTurkmenistanTuvaluUgandaUkraineUnited KingdomUnited StatesUpper middle incomeUruguayUzbekistanVanuatuVenezuela, RBVietnamWest Bank and GazaWorldYemen, Rep.ZambiaZimbabwe La ligne de temps
Cette échelle de temps montre un graphique de 1966 année à 2016 année France. Les données jusqu'à 1965 année ne sont pas présentés. Quantité d'observations actuelles selon dates: 51.
Source (désignation):
Les indicateurs du développement mondiale
Source (organisation):
World Bank national accounts data, and OECD National Accounts data files.
Catégories:
Economy & Growth
Dernière mise à jour
23 avr. 2017
Les indicateurs de changement de valeurs selon les années
Minimum:
56.663
1 janv. 1966
Maximum:
78.76
1 janv. 2016
Pour la date d''observation
Valeur
Changement absolu
Le changement par rapport à la valeur précédente
1 janv. 1966
56.663
+56.663
0.0%
1 janv. 1967
57.11
+0.448
0.79%
1 janv. 1968
57.681
+0.57
1.0%
1 janv. 1969
58.613
+0.932
1.62%
1 janv. 1970
59.4
+0.787
1.34%
1 janv. 1971
59.938
+0.537
0.9%
1 janv. 1972
60.129
+0.191
0.32%
1 janv. 1973
59.989
-0.14
-0.23%
1 janv. 1974
59.966
-0.022
-0.04%
1 janv. 1975
62.01
+2.043
3.41%
1 janv. 1976
62.914
+0.904
1.46%
1 janv. 1977
63.61
+0.696
1.11%
1 janv. 1978
64.261
+0.651
1.02%
1 janv. 1979
64.368
+0.107
0.17%
1 janv. 1980
64.613
+0.246
0.38%
1 janv. 1981
65.238
+0.625
0.97%
1 janv. 1982
66.162
+0.924
1.42%
1 janv. 1983
66.216
+0.054
0.08%
1 janv. 1984
66.964
+0.747
1.13%
1 janv. 1985
67.738
+0.774
1.16%
1 janv. 1986
67.859
+0.122
0.18%
1 janv. 1987
68.248
+0.388
0.57%
1 janv. 1988
68.843
+0.596
0.87%
1 janv. 1989
69.167
+0.324
0.47%
1 janv. 1990
69.589
+0.422
0.61%
1 janv. 1991
69.585
-0.004
-0.01%
1 janv. 1992
70.395
+0.81
1.16%
1 janv. 1993
70.894
+0.499
0.71%
1 janv. 1994
72.268
+1.374
1.94%
1 janv. 1995
72.881
+0.612
0.85%
1 janv. 1996
72.749
-0.131
-0.18%
1 janv. 1997
73.398
+0.648
0.89%
1 janv. 1998
73.655
+0.258
0.35%
1 janv. 1999
73.741
+0.086
0.12%
1 janv. 2000
74.151
+0.409
0.56%
1 janv. 2001
74.316
+0.165
0.22%
1 janv. 2002
74.746
+0.43
0.58%
1 janv. 2003
75.21
+0.464
0.62%
1 janv. 2004
75.879
+0.669
0.89%
1 janv. 2005
76.126
+0.247
0.33%
1 janv. 2006
76.621
+0.496
0.65%
1 janv. 2007
77.05
+0.429
0.56%
1 janv. 2008
77.137
+0.087
0.11%
1 janv. 2009
77.638
+0.501
0.65%
1 janv. 2010
78.492
+0.854
1.1%
1 janv. 2011
78.616
+0.124
0.16%
1 janv. 2012
78.327
-0.289
-0.37%
1 janv. 2013
78.489
+0.162
0.21%
1 janv. 2014
78.534
+0.044
0.06%
1 janv. 2015
78.7
+0.166
0.21%
1 janv. 2016
78.76
+0.06
0.08%
Classement des pays selon les statistiques actuelles par années


Commentaires: