29
/fr/
fr
AIzaSyAYiBZKx7MnpbEhh9jyipgxe19OcubqV5w
April 1, 2024
134294
France
FRA
true
2
1
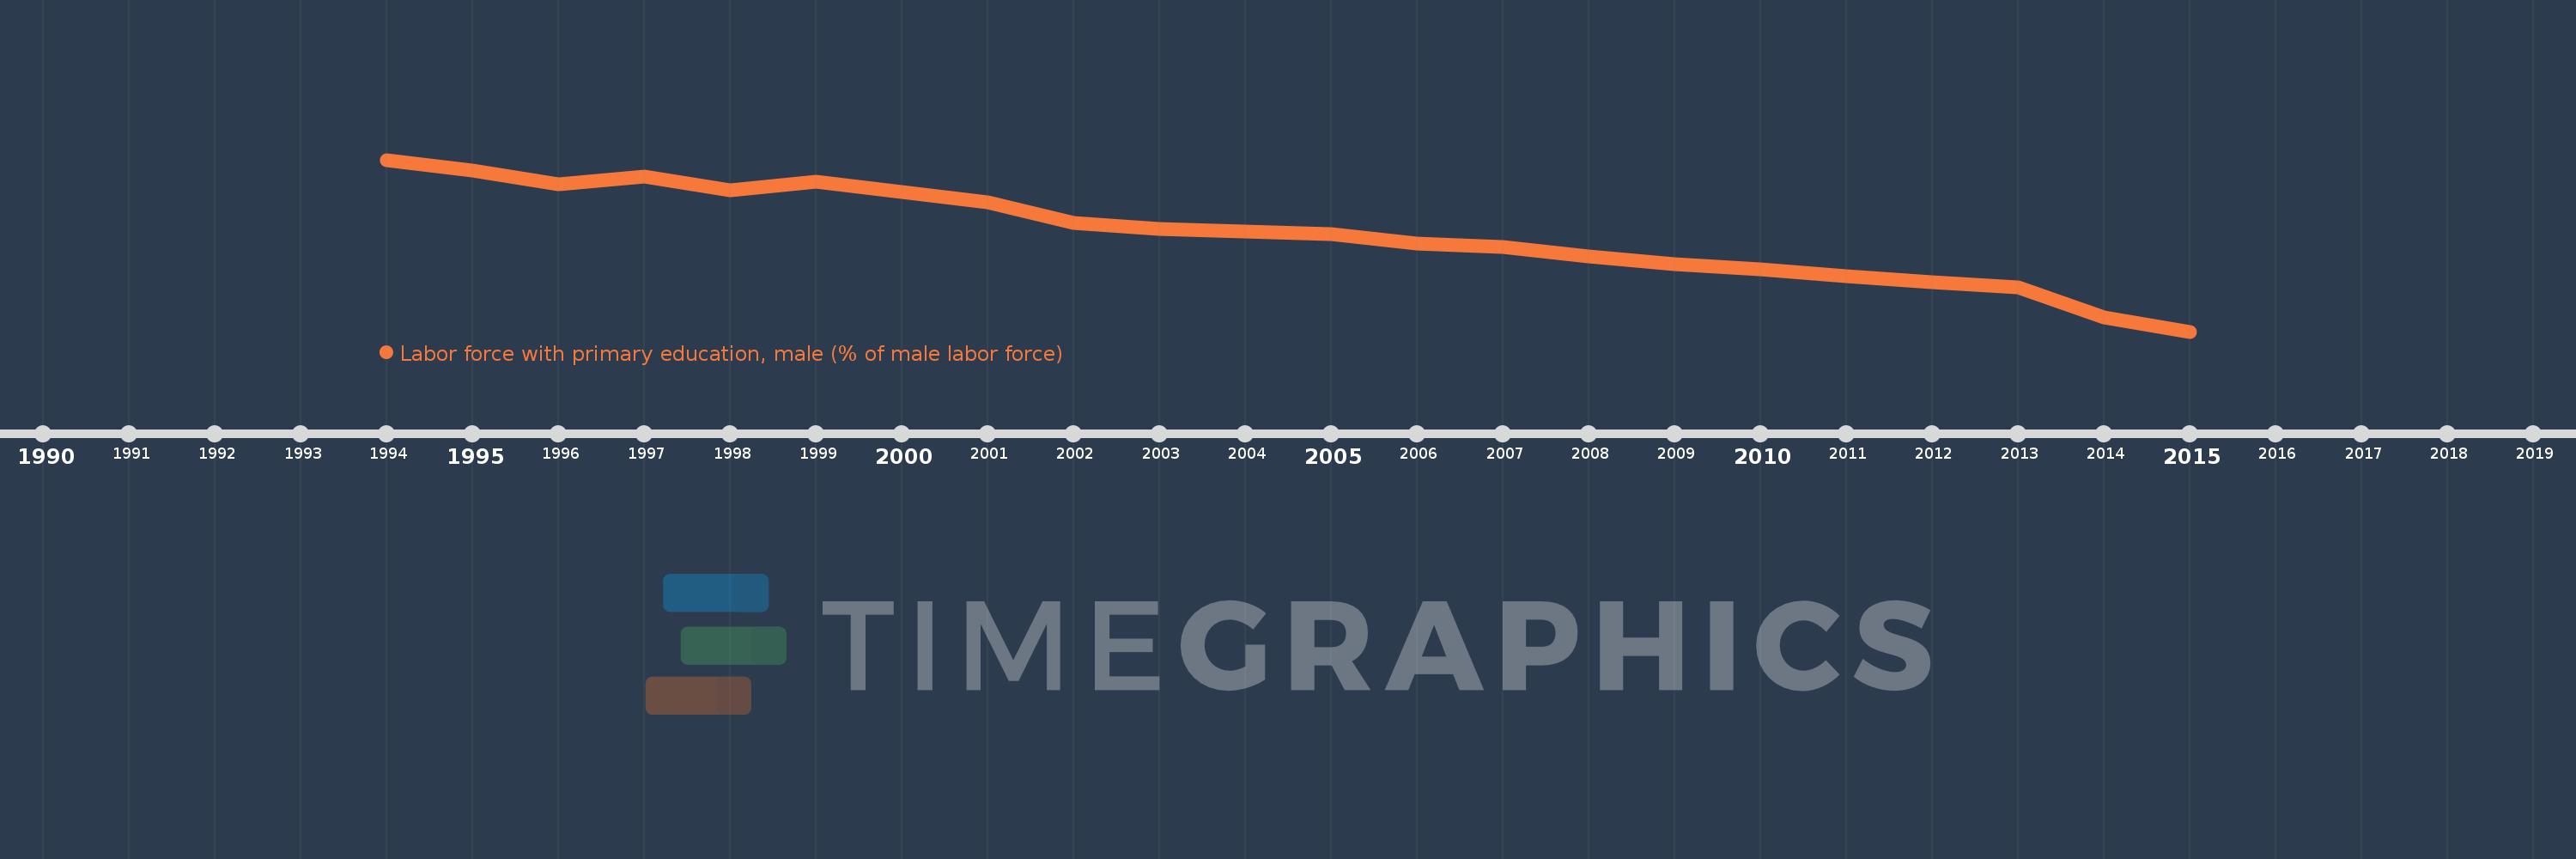
Labor force with primary education, male (% of male labor force)
2015,2014,2013,2012,2011,2010,2009,2008,2007,2006,2005,2004,2003,2002,2001,2000,1999,1998,1997,1996,1995,1994
Cette statistique dans les autres pays:
La ligne de temps
Cette échelle de temps montre un graphique de 1994 année à 2015 année France. Les données jusqu'à 1993 année ne sont pas présentés. Quantité d'observations actuelles selon dates: 22.
Source (désignation):
Les indicateurs du développement mondiale
Source (organisation):
International Labour Organization, Key Indicators of the Labour Market database.
Catégories:
Education, Social Protection & Labor, Gender
Dernière mise à jour
23 avr. 2017
Les indicateurs de changement de valeurs selon les années
Pour la date d''observation
Valeur
Changement absolu
Le changement par rapport à la valeur précédente
1 janv. 1994
35.9
+35.9
0.0%
1 janv. 1995
34.8
-1.1
-3.06%
1 janv. 1996
33.5
-1.3
-3.74%
1 janv. 1997
34.2
+0.7
2.09%
1 janv. 1998
32.9
-1.3
-3.8%
1 janv. 1999
33.7
+0.8
2.43%
1 janv. 2000
32.7
-1.0
-2.97%
1 janv. 2001
31.7
-1.0
-3.06%
1 janv. 2002
29.6
-2.1
-6.62%
1 janv. 2003
29.0
-0.6
-2.03%
1 janv. 2004
28.8
-0.2
-0.69%
1 janv. 2005
28.5
-0.3
-1.04%
1 janv. 2006
27.6
-0.9
-3.16%
1 janv. 2007
27.2
-0.4
-1.45%
1 janv. 2008
26.3
-0.9
-3.31%
1 janv. 2009
25.5
-0.8
-3.04%
1 janv. 2010
25.0
-0.5
-1.96%
1 janv. 2011
24.3
-0.7
-2.8%
1 janv. 2012
23.7
-0.6
-2.47%
1 janv. 2013
23.2
-0.5
-2.11%
1 janv. 2014
20.2
-3.0
-12.93%
1 janv. 2015
18.8
-1.4
-6.93%
Classement des pays selon les statistiques actuelles par années


Commentaires: