29
/fr/
fr
AIzaSyAYiBZKx7MnpbEhh9jyipgxe19OcubqV5w
April 1, 2024
133067
Finland
FIN
true
2
1
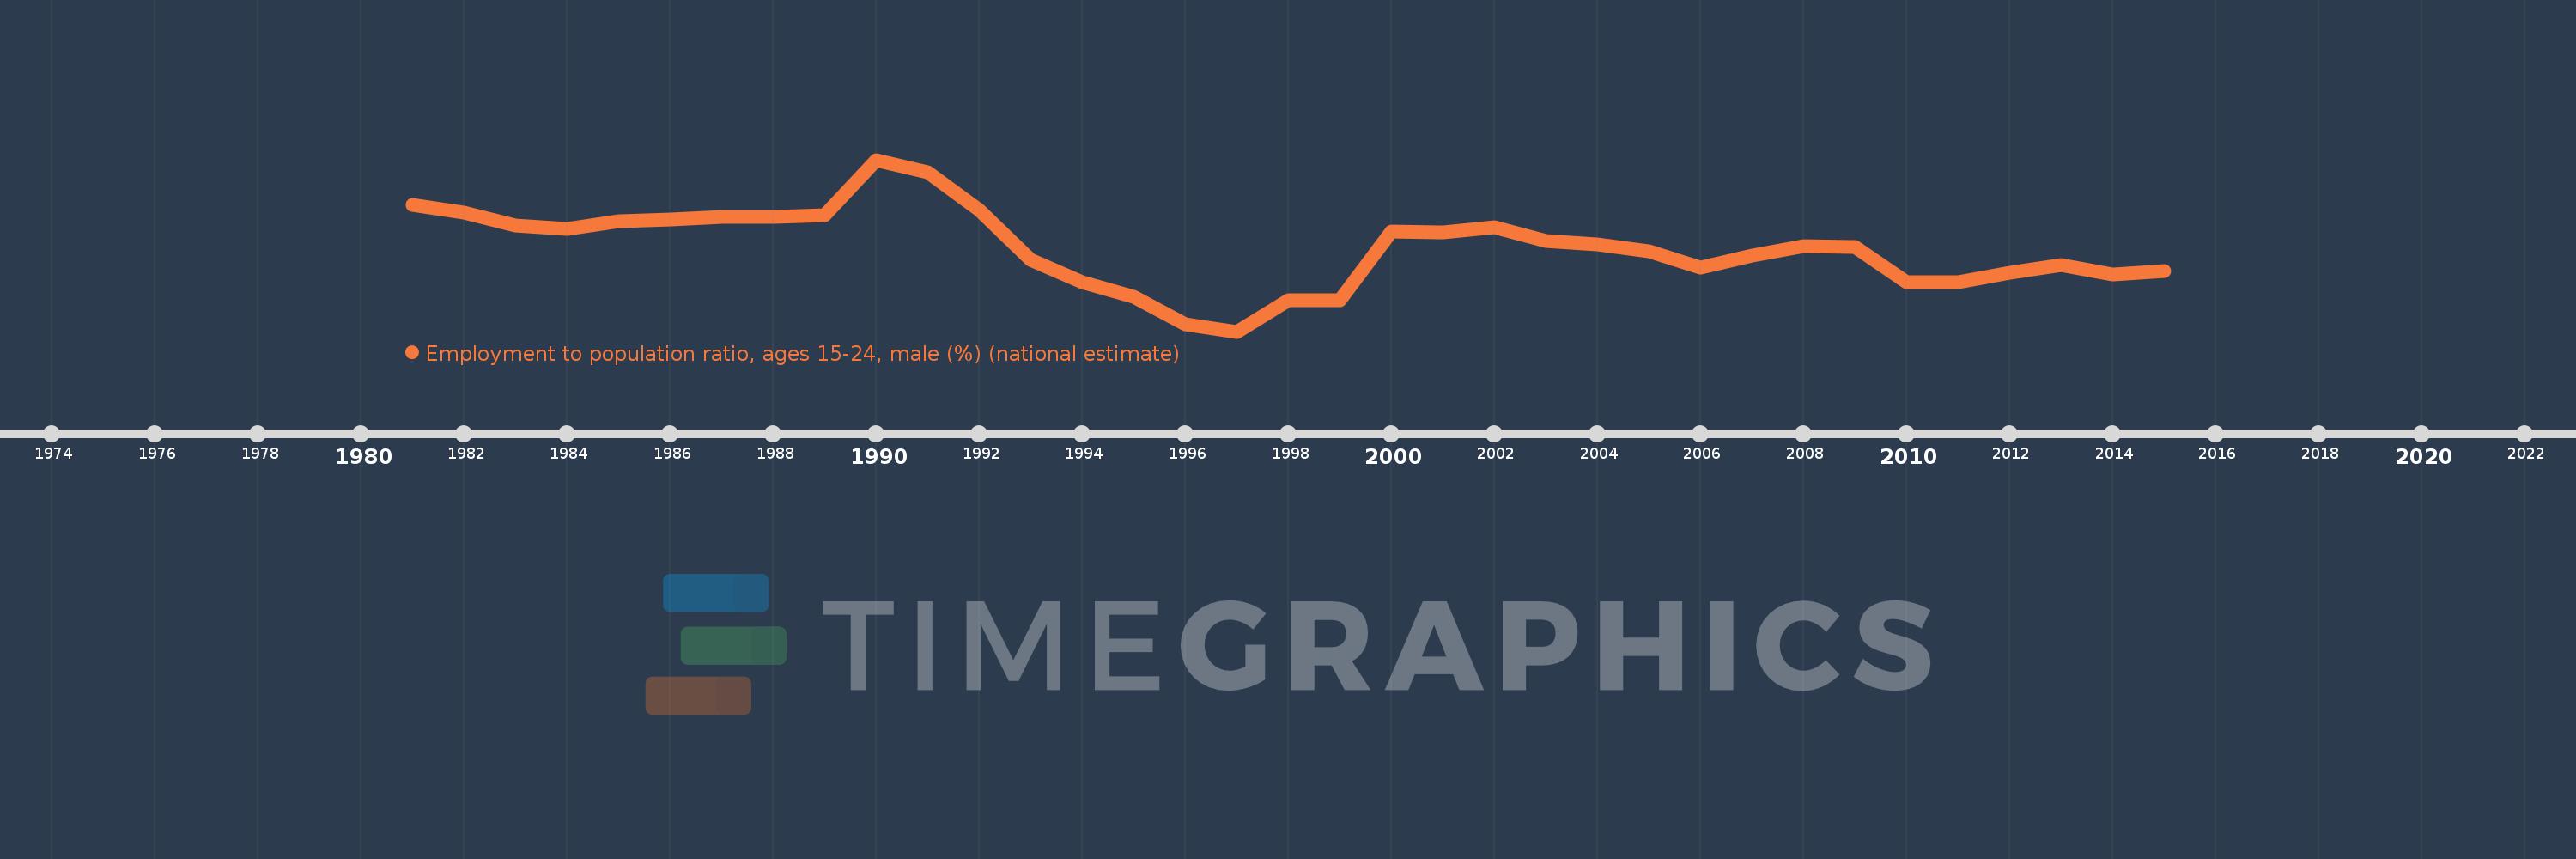
Employment to population ratio, ages 15-24, male (%) (national estimate)
2015,2014,2013,2012,2011,2010,2009,2008,2007,2006,2005,2004,2003,2002,2001,2000,1999,1998,1997,1996,1995,1994,1993,1992,1991,1990,1989,1988,1987,1986,1985,1984,1983,1982,1981
Cette statistique dans les autres pays:
La ligne de temps
Cette échelle de temps montre un graphique de 1981 année à 2015 année Finland. Les données jusqu'à 1980 année ne sont pas présentés. Quantité d'observations actuelles selon dates: 35.
Source (désignation):
Les indicateurs du développement mondiale
Source (organisation):
International Labour Organization, Key Indicators of the Labour Market database.
Catégories:
Social Protection & Labor
Dernière mise à jour
23 avr. 2017
Les indicateurs de changement de valeurs selon les années
Pour la date d''observation
Valeur
Changement absolu
Le changement par rapport à la valeur précédente
1 janv. 1981
52.0
+52.0
0.0%
1 janv. 1982
50.6
-1.4
-2.69%
1 janv. 1983
48.3
-2.3
-4.55%
1 janv. 1984
47.6
-0.7
-1.45%
1 janv. 1985
49.1
+1.5
3.15%
1 janv. 1986
49.3
+0.2
0.41%
1 janv. 1987
49.9
+0.6
1.22%
1 janv. 1988
49.9
0.0
0.0%
1 janv. 1989
50.1
+0.2
0.4%
1 janv. 1990
60.4
+10.3
20.56%
1 janv. 1991
58.1
-2.3
-3.81%
1 janv. 1992
51.1
-7.0
-12.05%
1 janv. 1993
41.9
-9.2
-18.0%
1 janv. 1994
37.7
-4.2
-10.02%
1 janv. 1995
35.1
-2.6
-6.9%
1 janv. 1996
30.0
-5.1
-14.53%
1 janv. 1997
28.6
-1.4
-4.67%
1 janv. 1998
34.4
+5.8
20.28%
1 janv. 1999
34.4
0.0
0.0%
1 janv. 2000
47.2
+12.8
37.21%
1 janv. 2001
47.0
-0.2
-0.42%
1 janv. 2002
47.9
+0.9
1.91%
1 janv. 2003
45.4
-2.5
-5.22%
1 janv. 2004
44.7
-0.7
-1.54%
1 janv. 2005
43.5
-1.2
-2.68%
1 janv. 2006
40.4
-3.1
-7.13%
1 janv. 2007
42.6
+2.2
5.45%
1 janv. 2008
44.5
+1.9
4.46%
1 janv. 2009
44.3
-0.2
-0.45%
1 janv. 2010
37.7
-6.6
-14.9%
1 janv. 2011
37.7
0.0
0.0%
1 janv. 2012
39.5
+1.8
4.77%
1 janv. 2013
41.0
+1.5
3.8%
1 janv. 2014
39.1
-1.9
-4.63%
1 janv. 2015
39.8
+0.7
1.79%
Classement des pays selon les statistiques actuelles par années


Commentaires: