29
/fr/
fr
AIzaSyAYiBZKx7MnpbEhh9jyipgxe19OcubqV5w
April 1, 2024
132240
Fiji
FJI
true
2
1
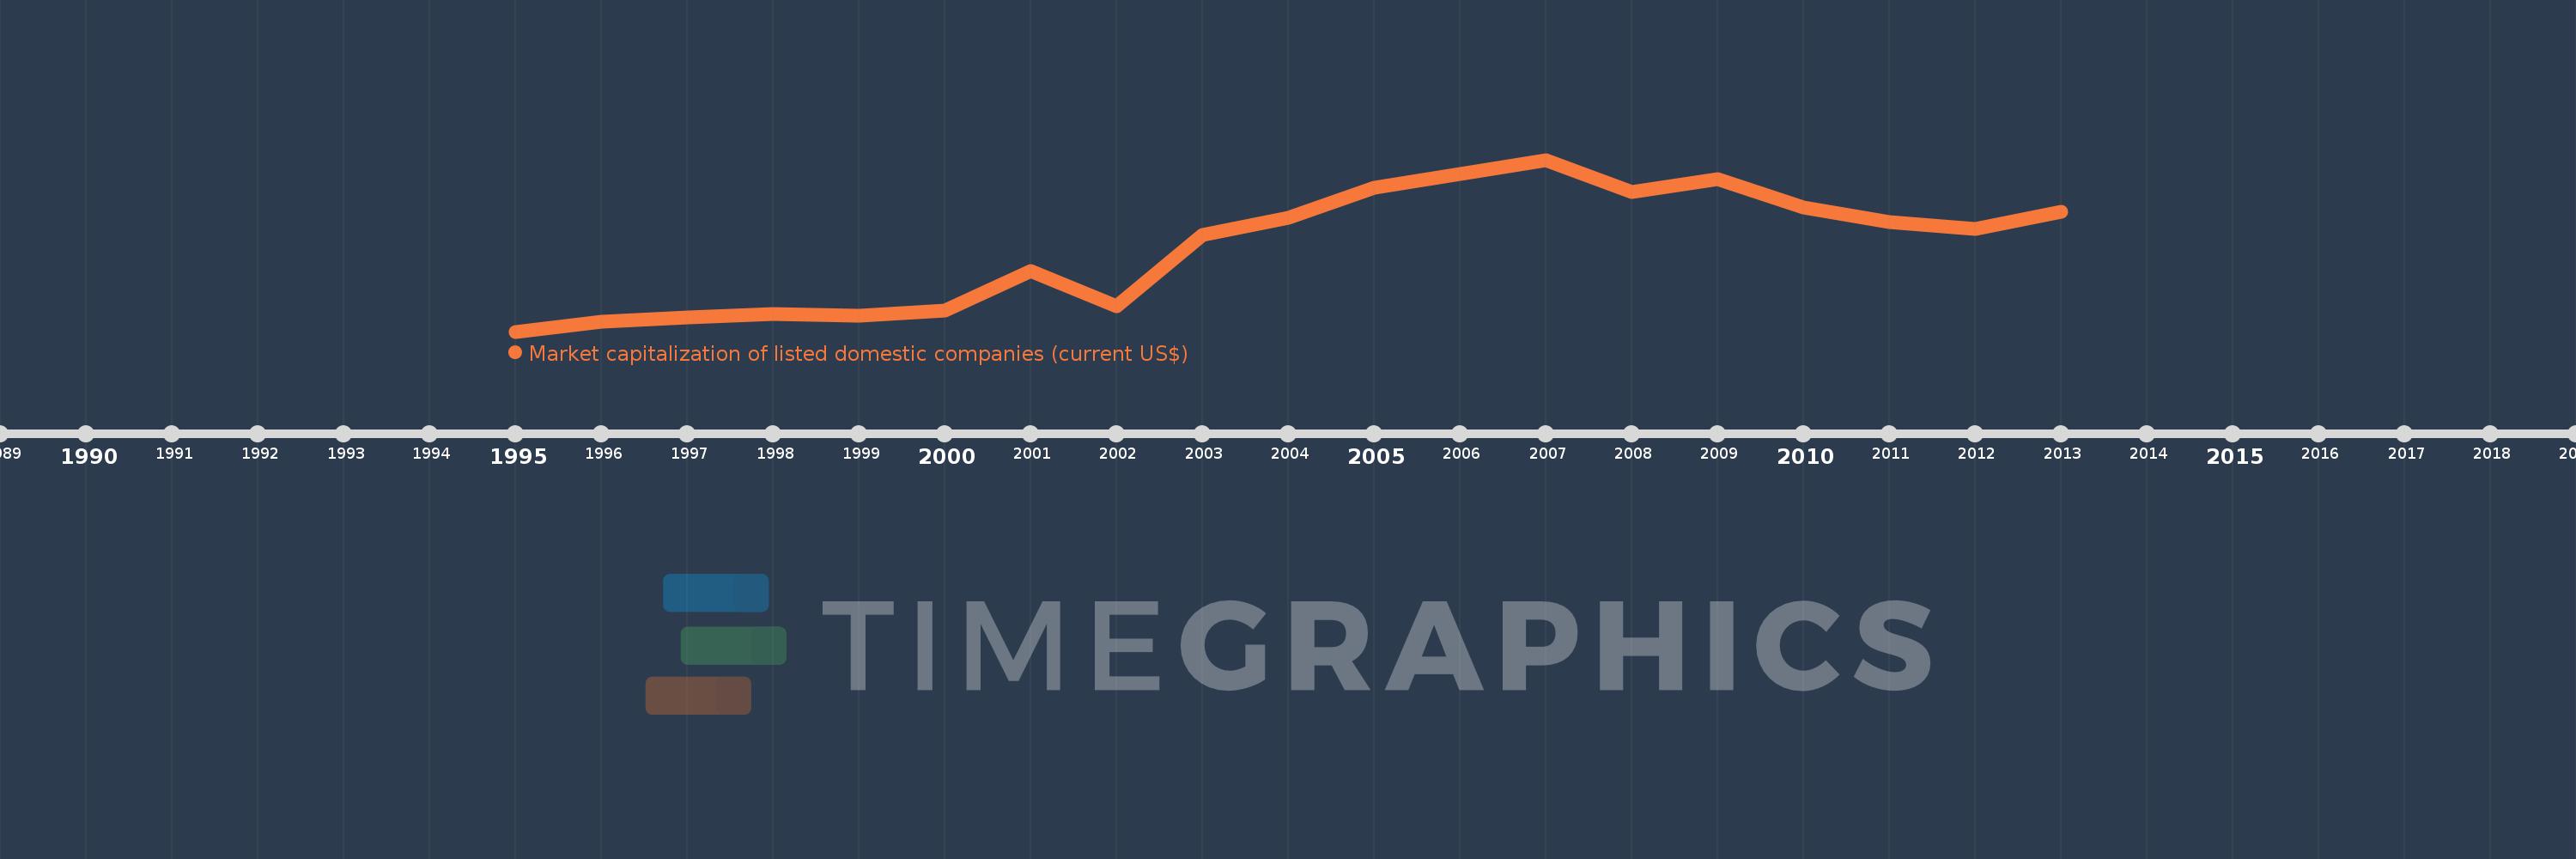
Market capitalization of listed domestic companies (current US$)
2013,2012,2011,2010,2009,2008,2007,2006,2005,2004,2003,2002,2001,2000,1999,1998,1997,1996,1995
Cette statistique dans les autres pays:
La ligne de temps
Cette échelle de temps montre un graphique de 1995 année à 2013 année Fiji. Les données jusqu'à 1994 année ne sont pas présentés. Quantité d'observations actuelles selon dates: 19.
Source (désignation):
Les indicateurs du développement mondiale
Source (organisation):
World Federation of Exchanges database.
Catégories:
Financial Sector
Dernière mise à jour
23 avr. 2017
Les indicateurs de changement de valeurs selon les années
Minimum:
32.0 mln.
1 janv. 1995
Maximum:
636.698 mln.
1 janv. 2007
Pour la date d''observation
Valeur
Changement absolu
Le changement par rapport à la valeur précédente
1 janv. 1995
32.0 mln.
+32.0 mln.
0.0%
1 janv. 1996
67.0 mln.
+35.0 mln.
109.38%
1 janv. 1997
82.0 mln.
+15.0 mln.
22.39%
1 janv. 1998
93.0 mln.
+11.0 mln.
13.41%
1 janv. 1999
88.0 mln.
-5.0 mln.
-5.38%
1 janv. 2000
107.514 mln.
+19.514 mln.
22.18%
1 janv. 2001
243.86 mln.
+136.346 mln.
126.82%
1 janv. 2002
121.447 mln.
-122.413 mln.
-50.2%
1 janv. 2003
372.723 mln.
+251.275 mln.
206.9%
1 janv. 2004
433.005 mln.
+60.282 mln.
16.17%
1 janv. 2005
538.651 mln.
+105.645 mln.
24.4%
1 janv. 2006
586.698 mln.
+48.048 mln.
8.92%
1 janv. 2007
636.698 mln.
+50.0 mln.
8.52%
1 janv. 2008
522.183 mln.
-114.515 mln.
-17.99%
1 janv. 2009
568.223 mln.
+46.04 mln.
8.82%
1 janv. 2010
468.337 mln.
-99.886 mln.
-17.58%
1 janv. 2011
418.762 mln.
-49.575 mln.
-10.59%
1 janv. 2012
392.209 mln.
-26.553 mln.
-6.34%
1 janv. 2013
452.461 mln.
+60.252 mln.
15.36%
Classement des pays selon les statistiques actuelles par années


Commentaires: