29
/fr/
fr
AIzaSyAYiBZKx7MnpbEhh9jyipgxe19OcubqV5w
April 1, 2024
130456
Ethiopia
ETH
true
2
1
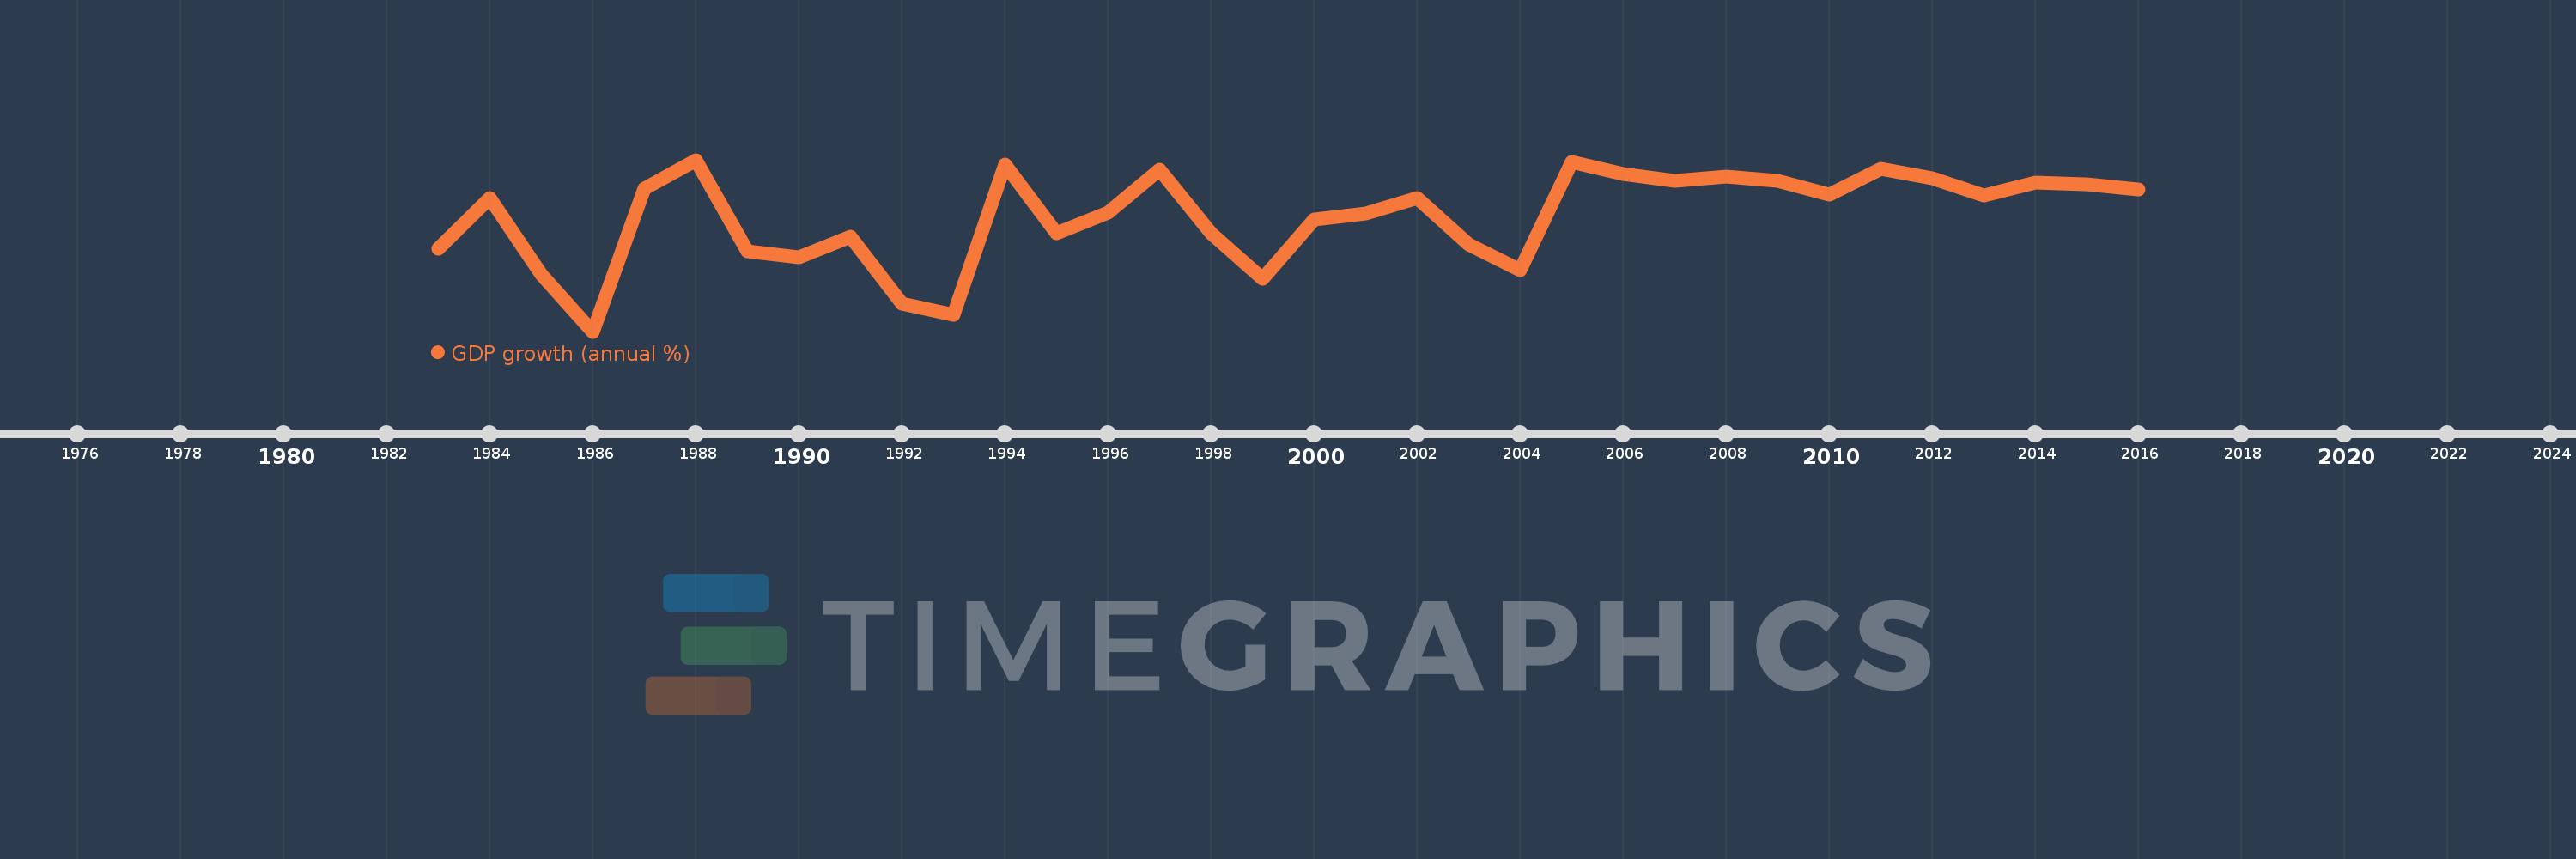
GDP growth (annual %)
2016,2015,2014,2013,2012,2011,2010,2009,2008,2007,2006,2005,2004,2003,2002,2001,2000,1999,1998,1997,1996,1995,1994,1993,1992,1991,1990,1989,1988,1987,1986,1985,1984,1983
Cette statistique dans les autres pays:
AfghanistanAlbaniaAlgeriaAndorraAngolaAntigua and BarbudaArab WorldArgentinaArmeniaArubaAustraliaAustriaAzerbaijanBahamas, TheBahrainBangladeshBarbadosBelarusBelgiumBelizeBeninBermudaBhutanBoliviaBosnia and HerzegovinaBotswanaBrazilBrunei DarussalamBulgariaBurkina FasoBurundiCabo VerdeCambodiaCameroonCanadaCaribbean small statesCayman IslandsCentral African RepublicCentral Europe and the BalticsChadChannel IslandsChileChinaColombiaComorosCongo, Dem. Rep.Congo, Rep.Costa RicaCote d'IvoireCroatiaCubaCyprusCzech RepublicDenmarkDjiboutiDominicaDominican RepublicEarly-demographic dividendEast Asia & PacificEast Asia & Pacific (excluding high income)East Asia & Pacific (IDA & IBRD countries)EcuadorEgypt, Arab Rep.El SalvadorEquatorial GuineaEritreaEstoniaEthiopiaEuro areaEurope & Central AsiaEurope & Central Asia (excluding high income)Europe & Central Asia (IDA & IBRD countries)European UnionFijiFinlandFragile and conflict affected situationsFranceFrench PolynesiaGabonGambia, TheGeorgiaGermanyGhanaGreeceGreenlandGrenadaGuatemalaGuineaGuinea-BissauGuyanaHaitiHeavily indebted poor countries (HIPC)High incomeHondurasHong Kong SAR, ChinaHungaryIBRD onlyIcelandIDA & IBRD totalIDA blendIDA onlyIDA totalIndiaIndonesiaIran, Islamic Rep.IraqIrelandIsle of ManIsraelItalyJamaicaJapanJordanKazakhstanKenyaKiribatiKorea, Rep.KosovoKuwaitKyrgyz RepublicLao PDRLate-demographic dividendLatin America & Caribbean Latin America & Caribbean (excluding high income)Latin America & the Caribbean (IDA & IBRD countries)LatviaLeast developed countries: UN classificationLebanonLesothoLiberiaLibyaLiechtensteinLithuaniaLow & middle incomeLow incomeLower middle incomeLuxembourgMacao SAR, ChinaMacedonia, FYRMadagascarMalawiMalaysiaMaldivesMaliMaltaMarshall IslandsMauritaniaMauritiusMexicoMicronesia, Fed. Sts.Middle East & North AfricaMiddle East & North Africa (excluding high income)Middle East & North Africa (IDA & IBRD countries)Middle incomeMoldovaMonacoMongoliaMontenegroMoroccoMozambiqueMyanmarNamibiaNauruNepalNetherlandsNew CaledoniaNew ZealandNicaraguaNigerNigeriaNorth AmericaNorwayOECD membersOmanOther small statesPacific island small statesPakistanPalauPanamaPapua New GuineaParaguayPeruPhilippinesPolandPortugalPost-demographic dividendPre-demographic dividendPuerto RicoQatarRomaniaRussian FederationRwandaSamoaSan MarinoSao Tome and PrincipeSaudi ArabiaSenegalSerbiaSeychellesSierra LeoneSingaporeSlovak RepublicSloveniaSmall statesSolomon IslandsSomaliaSouth AfricaSouth AsiaSouth Asia (IDA & IBRD)South SudanSpainSri LankaSt. Kitts and NevisSt. LuciaSt. Vincent and the GrenadinesSub-Saharan Africa Sub-Saharan Africa (excluding high income)Sub-Saharan Africa (IDA & IBRD countries)SudanSurinameSwazilandSwedenSwitzerlandSyrian Arab RepublicTajikistanTanzaniaThailandTimor-LesteTogoTongaTrinidad and TobagoTunisiaTurkeyTurkmenistanTuvaluUgandaUkraineUnited Arab EmiratesUnited KingdomUnited StatesUpper middle incomeUruguayUzbekistanVanuatuVenezuela, RBVietnamVirgin Islands (U.S.)West Bank and GazaWorldYemen, Rep.ZambiaZimbabwe La ligne de temps
Cette échelle de temps montre un graphique de 1983 année à 2016 année Ethiopia. Les données jusqu'à 1982 année ne sont pas présentés. Quantité d'observations actuelles selon dates: 34.
Source (désignation):
Les indicateurs du développement mondiale
Source (organisation):
World Bank national accounts data, and OECD National Accounts data files.
Catégories:
Economy & Growth
Dernière mise à jour
23 avr. 2017
Les indicateurs de changement de valeurs selon les années
Minimum:
-11.144
1 janv. 1986
Maximum:
13.859
1 janv. 1988
Pour la date d''observation
Valeur
Changement absolu
Le changement par rapport à la valeur précédente
1 janv. 1983
0.916
+0.916
0.0%
1 janv. 1984
8.235
+7.319
799.0%
1 janv. 1985
-2.848
-11.083
-134.58%
1 janv. 1986
-11.144
-8.296
291.3%
1 janv. 1987
9.662
+20.806
-186.7%
1 janv. 1988
13.859
+4.198
43.45%
1 janv. 1989
0.504
-13.356
-96.37%
1 janv. 1990
-0.361
-0.865
-171.68%
1 janv. 1991
2.726
+3.087
-855.16%
1 janv. 1992
-7.137
-9.864
-361.79%
1 janv. 1993
-8.672
-1.535
21.51%
1 janv. 1994
13.143
+21.815
-251.55%
1 janv. 1995
3.19
-9.953
-75.73%
1 janv. 1996
6.128
+2.938
92.09%
1 janv. 1997
12.426
+6.299
102.79%
1 janv. 1998
3.134
-9.292
-74.78%
1 janv. 1999
-3.458
-6.592
-210.35%
1 janv. 2000
5.162
+8.62
-249.28%
1 janv. 2001
6.073
+0.911
17.65%
1 janv. 2002
8.301
+2.228
36.69%
1 janv. 2003
1.515
-6.787
-81.75%
1 janv. 2004
-2.161
-3.676
-242.69%
1 janv. 2005
13.573
+15.734
-727.97%
1 janv. 2006
11.819
-1.754
-12.92%
1 janv. 2007
10.835
-0.984
-8.33%
1 janv. 2008
11.456
+0.621
5.74%
1 janv. 2009
10.789
-0.668
-5.83%
1 janv. 2010
8.803
-1.986
-18.41%
1 janv. 2011
12.551
+3.748
42.58%
1 janv. 2012
11.178
-1.372
-10.93%
1 janv. 2013
8.648
-2.53
-22.64%
1 janv. 2014
10.582
+1.934
22.37%
1 janv. 2015
10.279
-0.303
-2.86%
1 janv. 2016
9.608
-0.672
-6.53%
Classement des pays selon les statistiques actuelles par années


Commentaires: