29
/fr/
fr
AIzaSyAYiBZKx7MnpbEhh9jyipgxe19OcubqV5w
April 1, 2024
129837
Estonia
EST
true
2
1
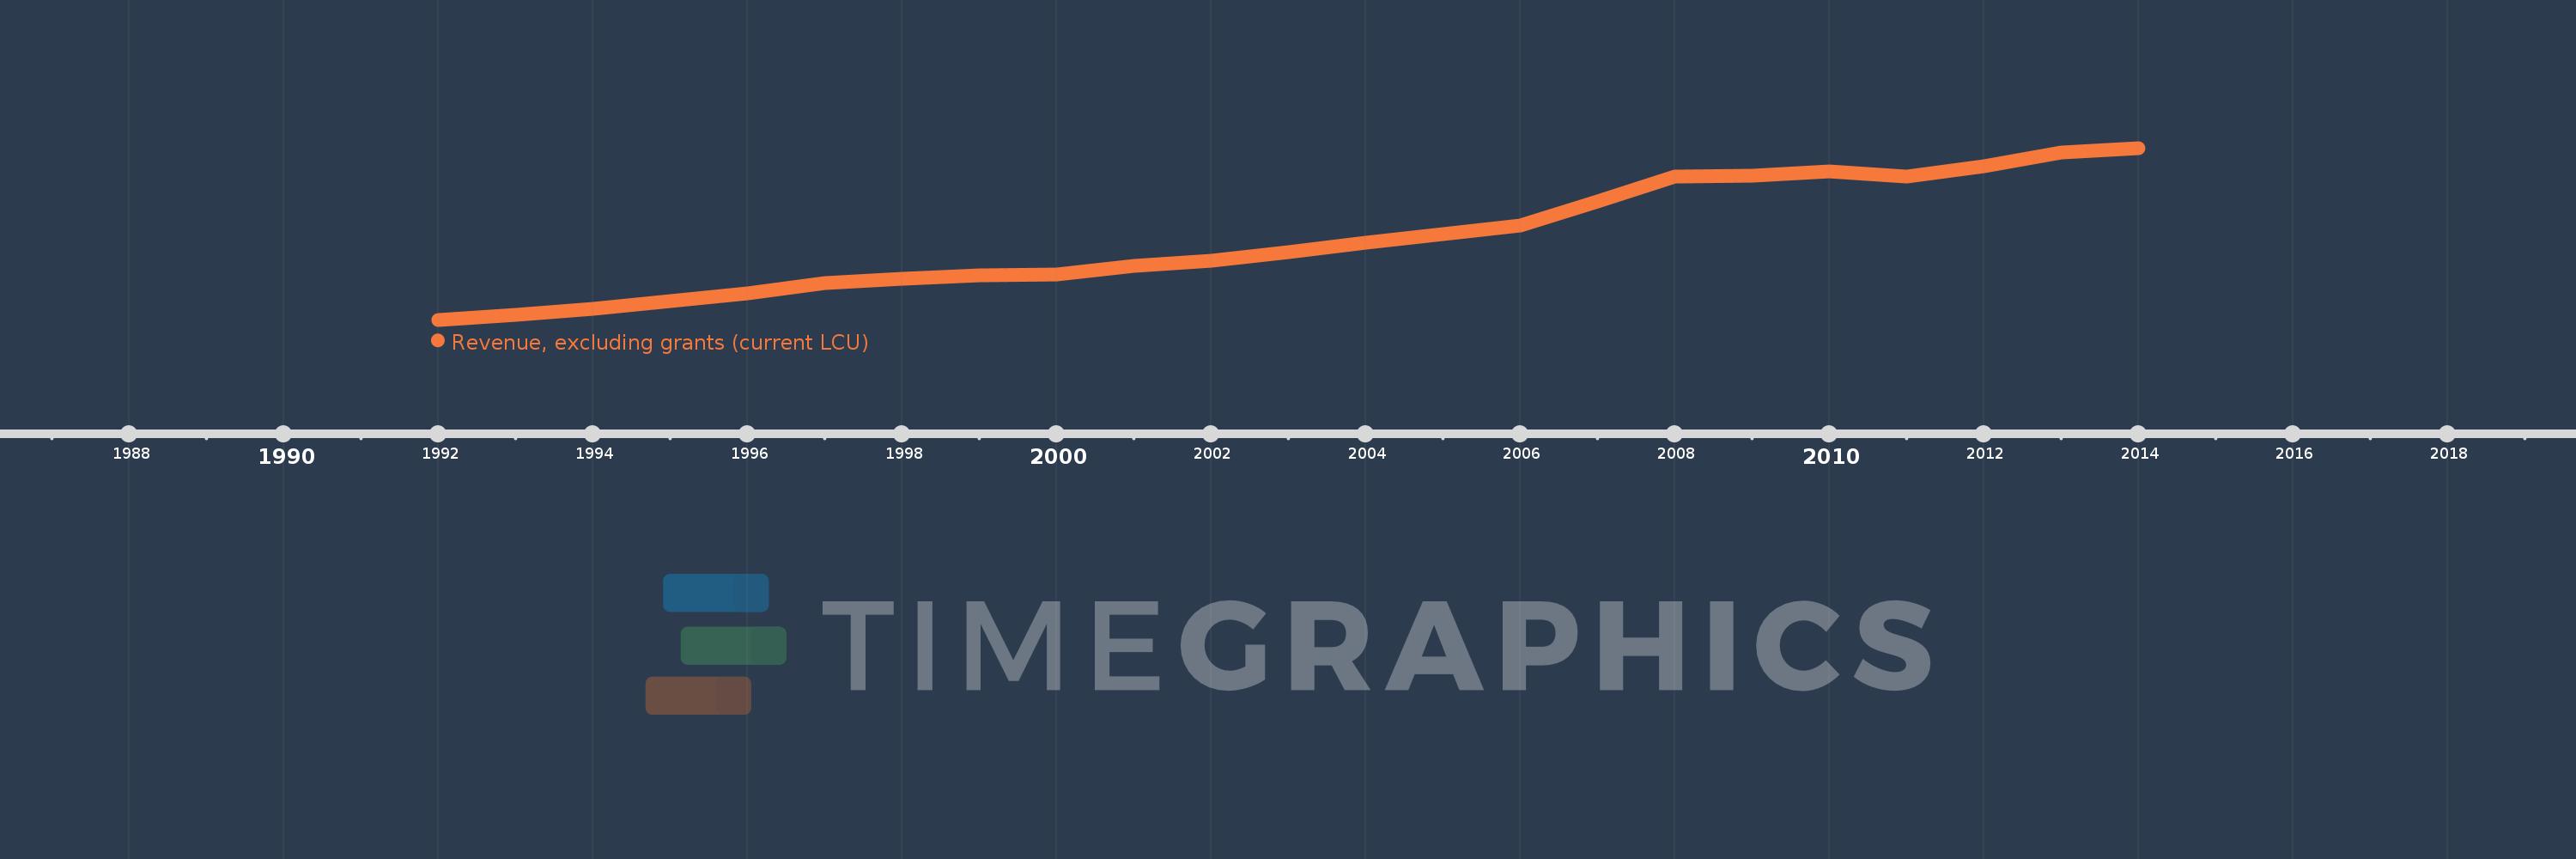
Revenue, excluding grants (current LCU)
2014,2013,2012,2011,2010,2009,2008,2007,2006,2005,2004,2003,2002,2001,2000,1999,1998,1997,1996,1995,1994,1993,1992
Cette statistique dans les autres pays:
AfghanistanAlbaniaAlgeriaAngolaAntigua and BarbudaArgentinaArmeniaAustraliaAustriaAzerbaijanBahamas, TheBahrainBangladeshBarbadosBelarusBelgiumBelizeBeninBhutanBoliviaBosnia and HerzegovinaBotswanaBrazilBulgariaBurkina FasoBurundiCabo VerdeCambodiaCanadaCentral African RepublicChileChinaColombiaCongo, Dem. Rep.Congo, Rep.Costa RicaCote d'IvoireCroatiaCyprusCzech RepublicDenmarkDominicaDominican RepublicEgypt, Arab Rep.El SalvadorEquatorial GuineaEstoniaEthiopiaFijiFinlandFranceGambia, TheGeorgiaGermanyGhanaGreeceGrenadaGuatemalaHondurasHong Kong SAR, ChinaHungaryIcelandIndiaIndonesiaIran, Islamic Rep.IraqIrelandIsraelItalyJamaicaJapanJordanKazakhstanKenyaKiribatiKorea, Rep.KuwaitKyrgyz RepublicLao PDRLatviaLebanonLesothoLiberiaLithuaniaLuxembourgMacao SAR, ChinaMacedonia, FYRMadagascarMalawiMalaysiaMaldivesMaliMaltaMauritiusMexicoMicronesia, Fed. Sts.MoldovaMongoliaMoroccoMozambiqueMyanmarNamibiaNepalNetherlandsNew ZealandNicaraguaNigeriaNorwayOmanPakistanPanamaPapua New GuineaParaguayPeruPhilippinesPolandPortugalQatarRomaniaRussian FederationRwandaSamoaSan MarinoSao Tome and PrincipeSenegalSerbiaSeychellesSierra LeoneSingaporeSlovak RepublicSloveniaSolomon IslandsSouth AfricaSpainSri LankaSt. Kitts and NevisSt. LuciaSt. Vincent and the GrenadinesSurinameSwazilandSwedenSwitzerlandSyrian Arab RepublicTajikistanTanzaniaThailandTimor-LesteTogoTrinidad and TobagoTunisiaTurkeyUgandaUkraineUnited Arab EmiratesUnited KingdomUnited StatesUruguayVanuatuVenezuela, RBVietnamWest Bank and GazaYemen, Rep.ZambiaZimbabwe La ligne de temps
Cette échelle de temps montre un graphique de 1992 année à 2014 année Estonia. Les données jusqu'à 1991 année ne sont pas présentés. Quantité d'observations actuelles selon dates: 23.
Source (désignation):
Les indicateurs du développement mondiale
Source (organisation):
International Monetary Fund, Government Finance Statistics Yearbook and data files.
Catégories:
Public Sector
Dernière mise à jour
23 avr. 2017
Les indicateurs de changement de valeurs selon les années
Minimum:
1.829 mln.
1 janv. 1992
Maximum:
389.503 mln.
1 janv. 2014
Pour la date d''observation
Valeur
Changement absolu
Le changement par rapport à la valeur précédente
1 janv. 1992
1.829 mln.
+1.829 mln.
0.0%
1 janv. 1993
12.233 mln.
+10.404 mln.
568.93%
1 janv. 1994
25.794 mln.
+13.561 mln.
110.86%
1 janv. 1995
43.074 mln.
+17.281 mln.
67.0%
1 janv. 1996
61.496 mln.
+18.421 mln.
42.77%
1 janv. 1997
84.907 mln.
+23.411 mln.
38.07%
1 janv. 1998
93.65 mln.
+8.743 mln.
10.3%
1 janv. 1999
101.677 mln.
+8.027 mln.
8.57%
1 janv. 2000
103.166 mln.
+1.489 mln.
1.46%
1 janv. 2001
123.215 mln.
+20.049 mln.
19.43%
1 janv. 2002
134.508 mln.
+11.293 mln.
9.17%
1 janv. 2003
155.139 mln.
+20.631 mln.
15.34%
1 janv. 2004
176.441 mln.
+21.302 mln.
13.73%
1 janv. 2005
195.825 mln.
+19.384 mln.
10.99%
1 janv. 2006
215.018 mln.
+19.193 mln.
9.8%
1 janv. 2007
268.659 mln.
+53.641 mln.
24.95%
1 janv. 2008
325.866 mln.
+57.207 mln.
21.29%
1 janv. 2009
326.486 mln.
+619.943 milles
0.19%
1 janv. 2010
336.546 mln.
+10.06 mln.
3.08%
1 janv. 2011
324.888 mln.
-11.657 mln.
-3.46%
1 janv. 2012
348.184 mln.
+23.296 mln.
7.17%
1 janv. 2013
379.156 mln.
+30.972 mln.
8.9%
1 janv. 2014
389.503 mln.
+10.347 mln.
2.73%
Classement des pays selon les statistiques actuelles par années


Commentaires: