29
/fr/
fr
AIzaSyAYiBZKx7MnpbEhh9jyipgxe19OcubqV5w
April 1, 2024
124952
Egypt, Arab Rep.
EGY
true
2
1
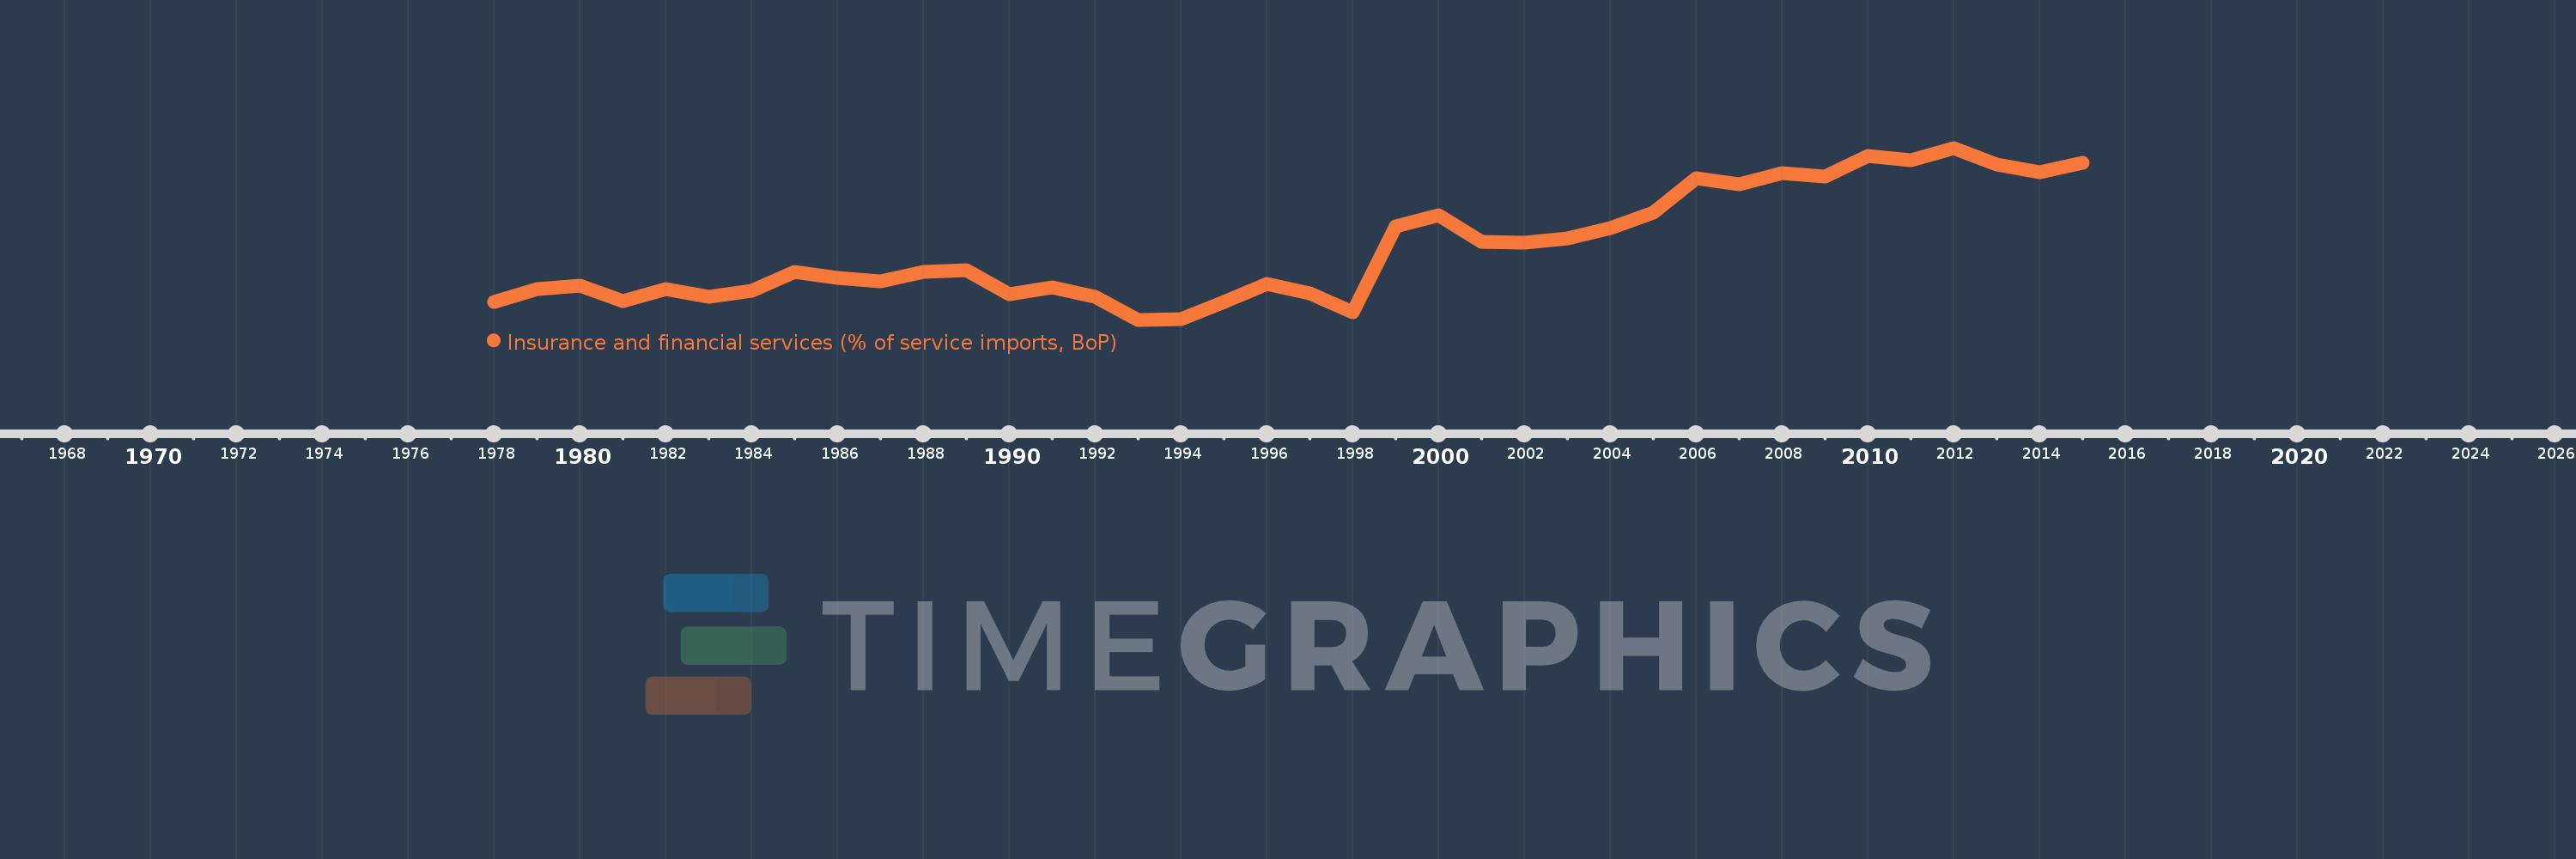
Insurance and financial services (% of service imports, BoP)
2015,2014,2013,2012,2011,2010,2009,2008,2007,2006,2005,2004,2003,2002,2001,2000,1999,1998,1997,1996,1995,1994,1993,1992,1991,1990,1989,1988,1987,1986,1985,1984,1983,1982,1981,1980,1979,1978
Cette statistique dans les autres pays:
AfghanistanAlbaniaAlgeriaAngolaAntigua and BarbudaArab WorldArgentinaArmeniaArubaAustraliaAustriaAzerbaijanBahamas, TheBahrainBangladeshBarbadosBelarusBelgiumBelizeBeninBermudaBhutanBoliviaBosnia and HerzegovinaBotswanaBrazilBrunei DarussalamBulgariaBurkina FasoBurundiCabo VerdeCambodiaCameroonCanadaCaribbean small statesCentral African RepublicCentral Europe and the BalticsChadChileChinaColombiaComorosCongo, Dem. Rep.Congo, Rep.Costa RicaCote d'IvoireCroatiaCuracaoCyprusCzech RepublicDenmarkDjiboutiDominicaDominican RepublicEarly-demographic dividendEast Asia & PacificEast Asia & Pacific (excluding high income)East Asia & Pacific (IDA & IBRD countries)EcuadorEgypt, Arab Rep.El SalvadorEquatorial GuineaEritreaEstoniaEthiopiaEuro areaEurope & Central AsiaEurope & Central Asia (excluding high income)Europe & Central Asia (IDA & IBRD countries)European UnionFaroe IslandsFijiFinlandFragile and conflict affected situationsFranceFrench PolynesiaGabonGambia, TheGeorgiaGermanyGhanaGreeceGrenadaGuatemalaGuineaGuinea-BissauGuyanaHaitiHeavily indebted poor countries (HIPC)High incomeHondurasHong Kong SAR, ChinaHungaryIBRD onlyIcelandIDA & IBRD totalIDA onlyIDA totalIndiaIndonesiaIran, Islamic Rep.IraqIrelandIsraelItalyJamaicaJapanJordanKazakhstanKenyaKiribatiKorea, Rep.KosovoKuwaitKyrgyz RepublicLao PDRLate-demographic dividendLatin America & Caribbean Latin America & Caribbean (excluding high income)Latin America & the Caribbean (IDA & IBRD countries)LatviaLeast developed countries: UN classificationLebanonLesothoLiberiaLibyaLithuaniaLow & middle incomeLow incomeLower middle incomeLuxembourgMacao SAR, ChinaMacedonia, FYRMadagascarMalawiMalaysiaMaldivesMaliMaltaMarshall IslandsMauritaniaMauritiusMexicoMicronesia, Fed. Sts.Middle East & North AfricaMiddle East & North Africa (excluding high income)Middle East & North Africa (IDA & IBRD countries)Middle incomeMoldovaMongoliaMontenegroMoroccoMozambiqueMyanmarNamibiaNepalNetherlandsNew CaledoniaNew ZealandNicaraguaNigerNigeriaNorth AmericaNorwayOECD membersOmanOther small statesPacific island small statesPakistanPalauPanamaPapua New GuineaParaguayPeruPhilippinesPolandPortugalPost-demographic dividendPre-demographic dividendQatarRomaniaRussian FederationRwandaSamoaSao Tome and PrincipeSaudi ArabiaSenegalSerbiaSeychellesSierra LeoneSingaporeSint Maarten (Dutch part)Slovak RepublicSloveniaSmall statesSolomon IslandsSouth AfricaSouth AsiaSouth Asia (IDA & IBRD)South SudanSpainSri LankaSt. Kitts and NevisSt. LuciaSt. Vincent and the GrenadinesSub-Saharan Africa Sub-Saharan Africa (excluding high income)Sub-Saharan Africa (IDA & IBRD countries)SudanSurinameSwazilandSwedenSwitzerlandSyrian Arab RepublicTajikistanTanzaniaThailandTimor-LesteTogoTongaTrinidad and TobagoTunisiaTurkeyTuvaluUgandaUkraineUnited KingdomUnited StatesUpper middle incomeUruguayVanuatuVenezuela, RBWest Bank and GazaWorldYemen, Rep.ZambiaZimbabwe La ligne de temps
Cette échelle de temps montre un graphique de 1978 année à 2015 année Egypt, Arab Rep.. Les données jusqu'à 1977 année ne sont pas présentés. Quantité d'observations actuelles selon dates: 38.
Source (désignation):
Les indicateurs du développement mondiale
Source (organisation):
International Monetary Fund, Balance of Payments Statistics Yearbook and data files.
Catégories:
Economy & Growth, Private Sector, Trade
Dernière mise à jour
23 avr. 2017
Les indicateurs de changement de valeurs selon les années
Minimum:
2.548
1 janv. 1993
Maximum:
10.749
1 janv. 2012
Pour la date d''observation
Valeur
Changement absolu
Le changement par rapport à la valeur précédente
1 janv. 1978
3.406
+3.406
0.0%
1 janv. 1979
4.011
+0.604
17.74%
1 janv. 1980
4.166
+0.156
3.88%
1 janv. 1981
3.438
-0.728
-17.47%
1 janv. 1982
4.026
+0.588
17.1%
1 janv. 1983
3.635
-0.391
-9.72%
1 janv. 1984
3.934
+0.298
8.21%
1 janv. 1985
4.836
+0.902
22.94%
1 janv. 1986
4.528
-0.308
-6.37%
1 janv. 1987
4.396
-0.131
-2.9%
1 janv. 1988
4.814
+0.418
9.51%
1 janv. 1989
4.908
+0.094
1.95%
1 janv. 1990
3.766
-1.142
-23.27%
1 janv. 1991
4.079
+0.313
8.3%
1 janv. 1992
3.627
-0.452
-11.08%
1 janv. 1993
2.548
-1.079
-29.75%
1 janv. 1994
2.571
+0.023
0.92%
1 janv. 1995
3.401
+0.83
32.28%
1 janv. 1996
4.268
+0.867
25.5%
1 janv. 1997
3.816
-0.453
-10.6%
1 janv. 1998
2.886
-0.93
-24.37%
1 janv. 1999
6.993
+4.107
142.31%
1 janv. 2000
7.549
+0.555
7.94%
1 janv. 2001
6.269
-1.279
-16.95%
1 janv. 2002
6.232
-0.037
-0.6%
1 janv. 2003
6.435
+0.204
3.27%
1 janv. 2004
6.927
+0.491
7.64%
1 janv. 2005
7.671
+0.744
10.75%
1 janv. 2006
9.317
+1.646
21.45%
1 janv. 2007
9.03
-0.287
-3.08%
1 janv. 2008
9.531
+0.501
5.55%
1 janv. 2009
9.398
-0.133
-1.39%
1 janv. 2010
10.369
+0.971
10.33%
1 janv. 2011
10.144
-0.226
-2.18%
1 janv. 2012
10.749
+0.605
5.97%
1 janv. 2013
9.943
-0.806
-7.5%
1 janv. 2014
9.59
-0.353
-3.55%
1 janv. 2015
10.056
+0.466
4.86%
Classement des pays selon les statistiques actuelles par années


Commentaires: