29
/fr/
fr
AIzaSyAYiBZKx7MnpbEhh9jyipgxe19OcubqV5w
April 1, 2024
120550
Djibouti
DJI
true
2
1
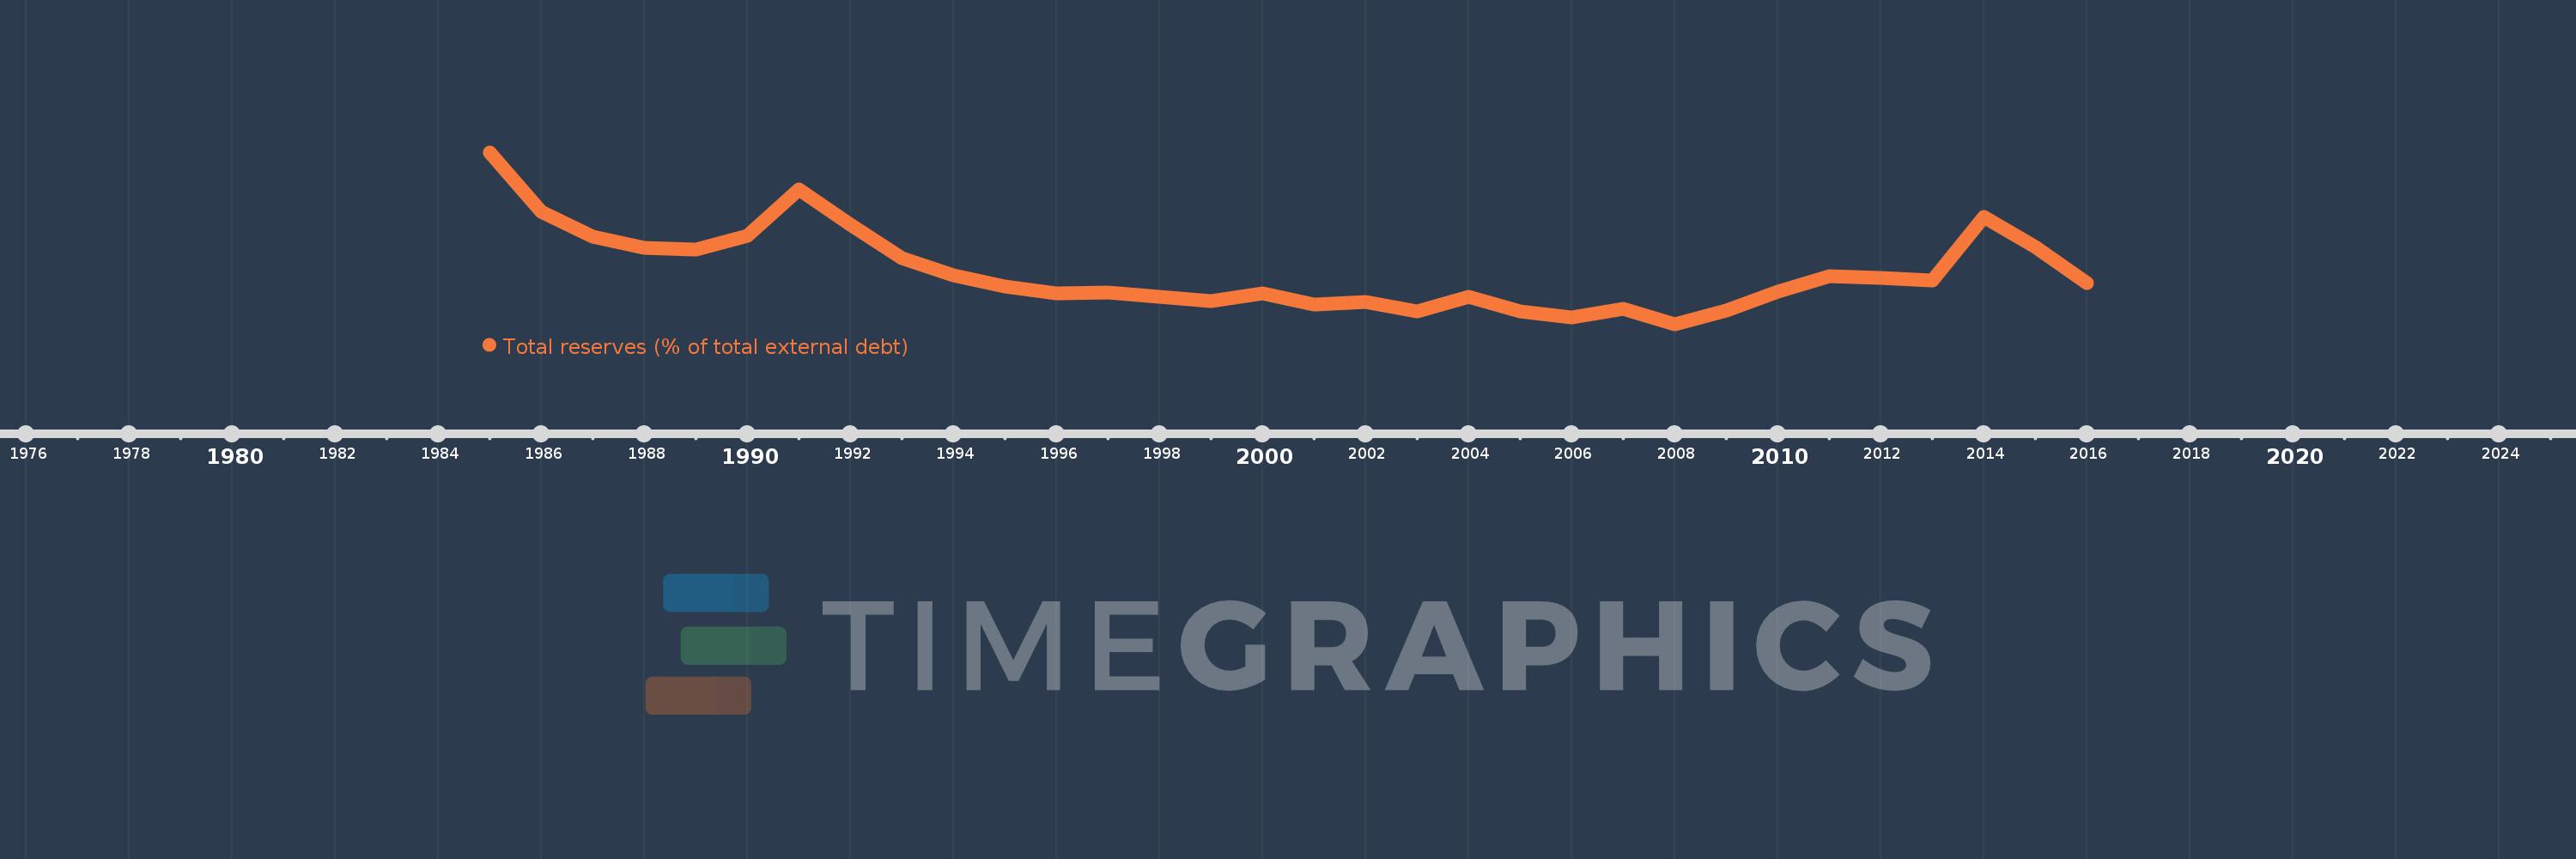
Total reserves (% of total external debt)
2016,2015,2014,2013,2012,2011,2010,2009,2008,2007,2006,2005,2004,2003,2002,2001,2000,1999,1998,1997,1996,1995,1994,1993,1992,1991,1990,1989,1988,1987,1986,1985
Cette statistique dans les autres pays:
La ligne de temps
Cette échelle de temps montre un graphique de 1985 année à 2016 année Djibouti. Les données jusqu'à 1984 année ne sont pas présentés. Quantité d'observations actuelles selon dates: 32.
Source (désignation):
Les indicateurs du développement mondiale
Source (organisation):
World Bank, International Debt Statistics.
Catégories:
Financial Sector, External Debt
Dernière mise à jour
23 avr. 2017
Les indicateurs de changement de valeurs selon les années
Minimum:
16.268
1 janv. 2008
Maximum:
72.454
1 janv. 1985
Pour la date d''observation
Valeur
Changement absolu
Le changement par rapport à la valeur précédente
1 janv. 1985
72.454
+72.454
0.0%
1 janv. 1986
53.077
-19.377
-26.74%
1 janv. 1987
44.955
-8.122
-15.3%
1 janv. 1988
41.144
-3.811
-8.48%
1 janv. 1989
40.661
-0.484
-1.18%
1 janv. 1990
45.069
+4.408
10.84%
1 janv. 1991
60.3
+15.231
33.8%
1 janv. 1992
48.815
-11.485
-19.05%
1 janv. 1993
37.913
-10.902
-22.33%
1 janv. 1994
32.303
-5.61
-14.8%
1 janv. 1995
28.627
-3.676
-11.38%
1 janv. 1996
26.485
-2.142
-7.48%
1 janv. 1997
26.761
+0.276
1.04%
1 janv. 1998
25.344
-1.417
-5.3%
1 janv. 1999
23.819
-1.525
-6.02%
1 janv. 2000
26.215
+2.397
10.06%
1 janv. 2001
22.777
-3.439
-13.12%
1 janv. 2002
23.466
+0.69
3.03%
1 janv. 2003
20.564
-2.903
-12.37%
1 janv. 2004
25.347
+4.784
23.26%
1 janv. 2005
20.437
-4.91
-19.37%
1 janv. 2006
18.349
-2.089
-10.22%
1 janv. 2007
21.254
+2.905
15.83%
1 janv. 2008
16.268
-4.986
-23.46%
1 janv. 2009
20.736
+4.468
27.46%
1 janv. 2010
26.959
+6.223
30.01%
1 janv. 2011
31.983
+5.023
18.63%
1 janv. 2012
31.333
-0.65
-2.03%
1 janv. 2013
30.632
-0.701
-2.24%
1 janv. 2014
51.307
+20.675
67.5%
1 janv. 2015
41.404
-9.902
-19.3%
1 janv. 2016
29.853
-11.551
-27.9%
Classement des pays selon les statistiques actuelles par années


Commentaires: