29
/fr/
fr
AIzaSyAYiBZKx7MnpbEhh9jyipgxe19OcubqV5w
April 1, 2024
118854
Denmark
DNK
true
2
1
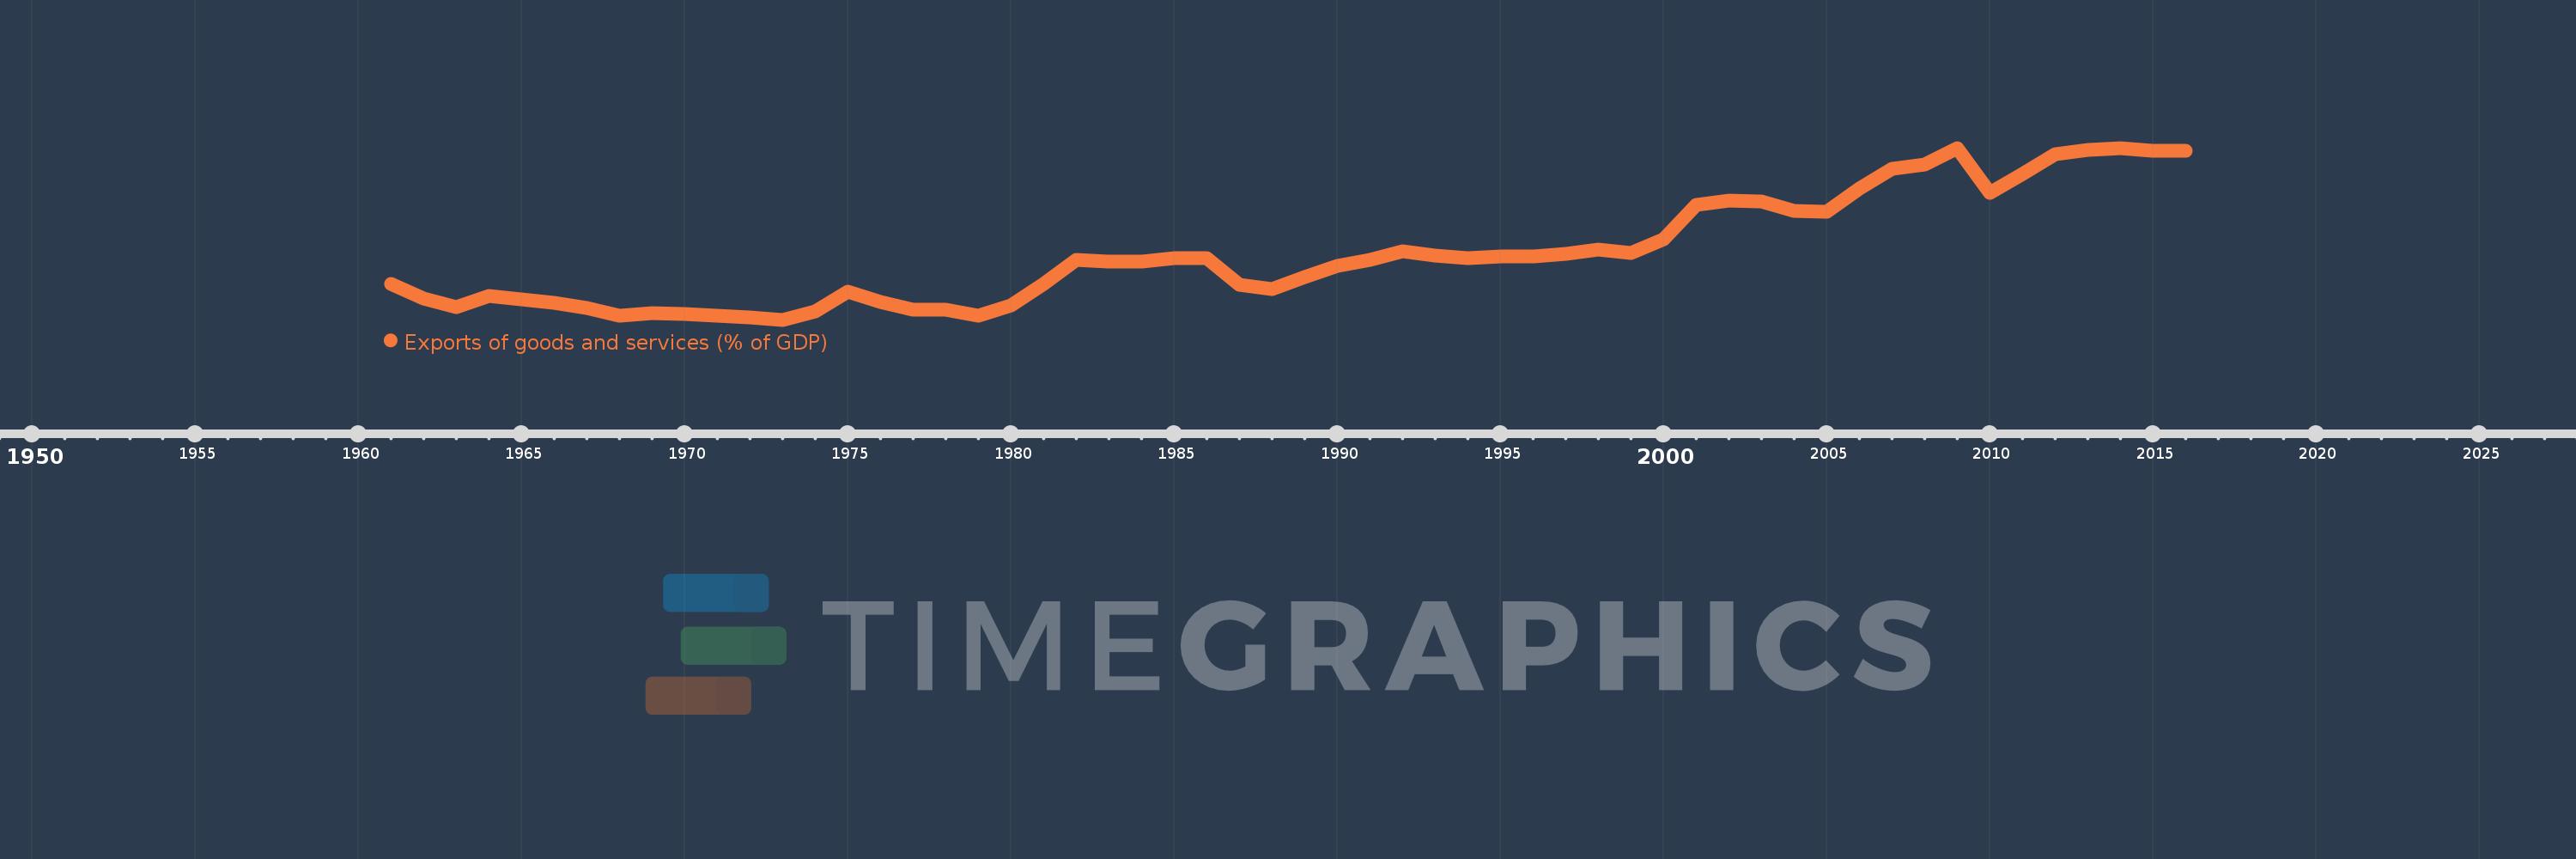
Exports of goods and services (% of GDP)
2016,2015,2014,2013,2012,2011,2010,2009,2008,2007,2006,2005,2004,2003,2002,2001,2000,1999,1998,1997,1996,1995,1994,1993,1992,1991,1990,1989,1988,1987,1986,1985,1984,1983,1982,1981,1980,1979,1978,1977,1976,1975,1974,1973,1972,1971,1970,1969,1968,1967,1966,1965,1964,1963,1962,1961
Cette statistique dans les autres pays:
AfghanistanAlbaniaAlgeriaAngolaAntigua and BarbudaArab WorldArgentinaArmeniaArubaAustraliaAustriaAzerbaijanBahamas, TheBahrainBangladeshBarbadosBelarusBelgiumBelizeBeninBermudaBhutanBoliviaBosnia and HerzegovinaBotswanaBrazilBrunei DarussalamBulgariaBurkina FasoBurundiCabo VerdeCambodiaCameroonCanadaCaribbean small statesCentral African RepublicCentral Europe and the BalticsChadChileChinaColombiaComorosCongo, Dem. Rep.Congo, Rep.Costa RicaCote d'IvoireCroatiaCubaCyprusCzech RepublicDenmarkDjiboutiDominicaDominican RepublicEarly-demographic dividendEast Asia & PacificEast Asia & Pacific (excluding high income)East Asia & Pacific (IDA & IBRD countries)EcuadorEgypt, Arab Rep.El SalvadorEquatorial GuineaEritreaEstoniaEthiopiaEuro areaEurope & Central AsiaEurope & Central Asia (excluding high income)Europe & Central Asia (IDA & IBRD countries)European UnionFaroe IslandsFijiFinlandFragile and conflict affected situationsFranceFrench PolynesiaGabonGambia, TheGeorgiaGermanyGhanaGreeceGrenadaGuatemalaGuineaGuinea-BissauGuyanaHaitiHeavily indebted poor countries (HIPC)High incomeHondurasHong Kong SAR, ChinaHungaryIBRD onlyIcelandIDA & IBRD totalIDA blendIDA onlyIDA totalIndiaIndonesiaIran, Islamic Rep.IraqIrelandIsraelItalyJamaicaJapanJordanKazakhstanKenyaKiribatiKorea, Rep.KosovoKuwaitKyrgyz RepublicLao PDRLate-demographic dividendLatin America & Caribbean Latin America & Caribbean (excluding high income)Latin America & the Caribbean (IDA & IBRD countries)LatviaLeast developed countries: UN classificationLebanonLesothoLiberiaLibyaLithuaniaLow & middle incomeLow incomeLower middle incomeLuxembourgMacao SAR, ChinaMacedonia, FYRMadagascarMalawiMalaysiaMaldivesMaliMaltaMauritaniaMauritiusMexicoMicronesia, Fed. Sts.Middle East & North AfricaMiddle East & North Africa (excluding high income)Middle East & North Africa (IDA & IBRD countries)Middle incomeMoldovaMongoliaMontenegroMoroccoMozambiqueMyanmarNamibiaNepalNetherlandsNew CaledoniaNew ZealandNicaraguaNigerNigeriaNorth AmericaNorwayOECD membersOmanOther small statesPacific island small statesPakistanPalauPanamaPapua New GuineaParaguayPeruPhilippinesPolandPortugalPost-demographic dividendPre-demographic dividendPuerto RicoQatarRomaniaRussian FederationRwandaSamoaSaudi ArabiaSenegalSerbiaSeychellesSierra LeoneSingaporeSlovak RepublicSloveniaSmall statesSolomon IslandsSomaliaSouth AfricaSouth AsiaSouth Asia (IDA & IBRD)South SudanSpainSri LankaSt. Kitts and NevisSt. LuciaSt. Vincent and the GrenadinesSub-Saharan Africa Sub-Saharan Africa (excluding high income)Sub-Saharan Africa (IDA & IBRD countries)SudanSurinameSwazilandSwedenSwitzerlandSyrian Arab RepublicTajikistanTanzaniaThailandTimor-LesteTogoTongaTrinidad and TobagoTunisiaTurkeyTurkmenistanUgandaUkraineUnited Arab EmiratesUnited KingdomUnited StatesUpper middle incomeUruguayUzbekistanVanuatuVenezuela, RBVietnamWest Bank and GazaWorldYemen, Rep.ZambiaZimbabwe La ligne de temps
Cette échelle de temps montre un graphique de 1961 année à 2016 année Denmark. Les données jusqu'à 1960 année ne sont pas présentés. Quantité d'observations actuelles selon dates: 56.
Source (désignation):
Les indicateurs du développement mondiale
Source (organisation):
World Bank national accounts data, and OECD National Accounts data files.
Catégories:
Economy & Growth, Trade
Dernière mise à jour
23 avr. 2017
Les indicateurs de changement de valeurs selon les années
Minimum:
26.661
1 janv. 1973
Maximum:
53.898
1 janv. 2014
Pour la date d''observation
Valeur
Changement absolu
Le changement par rapport à la valeur précédente
1 janv. 1961
32.31
+32.31
0.0%
1 janv. 1962
29.997
-2.313
-7.16%
1 janv. 1963
28.619
-1.378
-4.59%
1 janv. 1964
30.403
+1.784
6.23%
1 janv. 1965
29.852
-0.551
-1.81%
1 janv. 1966
29.297
-0.555
-1.86%
1 janv. 1967
28.552
-0.745
-2.54%
1 janv. 1968
27.336
-1.216
-4.26%
1 janv. 1969
27.663
+0.328
1.2%
1 janv. 1970
27.551
-0.112
-0.4%
1 janv. 1971
27.313
-0.238
-0.86%
1 janv. 1972
27.072
-0.242
-0.89%
1 janv. 1973
26.661
-0.411
-1.52%
1 janv. 1974
28.001
+1.341
5.03%
1 janv. 1975
31.074
+3.073
10.97%
1 janv. 1976
29.42
-1.654
-5.32%
1 janv. 1977
28.264
-1.156
-3.93%
1 janv. 1978
28.305
+0.041
0.14%
1 janv. 1979
27.334
-0.971
-3.43%
1 janv. 1980
28.977
+1.644
6.01%
1 janv. 1981
32.356
+3.379
11.66%
1 janv. 1982
36.123
+3.767
11.64%
1 janv. 1983
35.933
-0.19
-0.53%
1 janv. 1984
35.936
+0.004
0.01%
1 janv. 1985
36.366
+0.429
1.19%
1 janv. 1986
36.483
+0.118
0.32%
1 janv. 1987
32.196
-4.287
-11.75%
1 janv. 1988
31.565
-0.631
-1.96%
1 janv. 1989
33.421
+1.856
5.88%
1 janv. 1990
35.25
+1.83
5.47%
1 janv. 1991
36.195
+0.944
2.68%
1 janv. 1992
37.549
+1.354
3.74%
1 janv. 1993
36.874
-0.676
-1.8%
1 janv. 1994
36.401
-0.472
-1.28%
1 janv. 1995
36.719
+0.318
0.87%
1 janv. 1996
36.666
-0.053
-0.15%
1 janv. 1997
37.119
+0.453
1.24%
1 janv. 1998
37.812
+0.693
1.87%
1 janv. 1999
37.234
-0.578
-1.53%
1 janv. 2000
39.394
+2.16
5.8%
1 janv. 2001
44.889
+5.496
13.95%
1 janv. 2002
45.595
+0.706
1.57%
1 janv. 2003
45.399
-0.197
-0.43%
1 janv. 2004
43.877
-1.521
-3.35%
1 janv. 2005
43.802
-0.076
-0.17%
1 janv. 2006
47.396
+3.594
8.2%
1 janv. 2007
50.535
+3.139
6.62%
1 janv. 2008
51.336
+0.802
1.59%
1 janv. 2009
53.848
+2.511
4.89%
1 janv. 2010
46.717
-7.131
-13.24%
1 janv. 2011
49.72
+3.003
6.43%
1 janv. 2012
52.944
+3.224
6.48%
1 janv. 2013
53.573
+0.629
1.19%
1 janv. 2014
53.898
+0.325
0.61%
1 janv. 2015
53.383
-0.516
-0.96%
1 janv. 2016
53.418
+0.035
0.07%
Classement des pays selon les statistiques actuelles par années


Commentaires: