29
/fr/
fr
AIzaSyAYiBZKx7MnpbEhh9jyipgxe19OcubqV5w
April 1, 2024
116104
Cuba
CUB
true
2
1
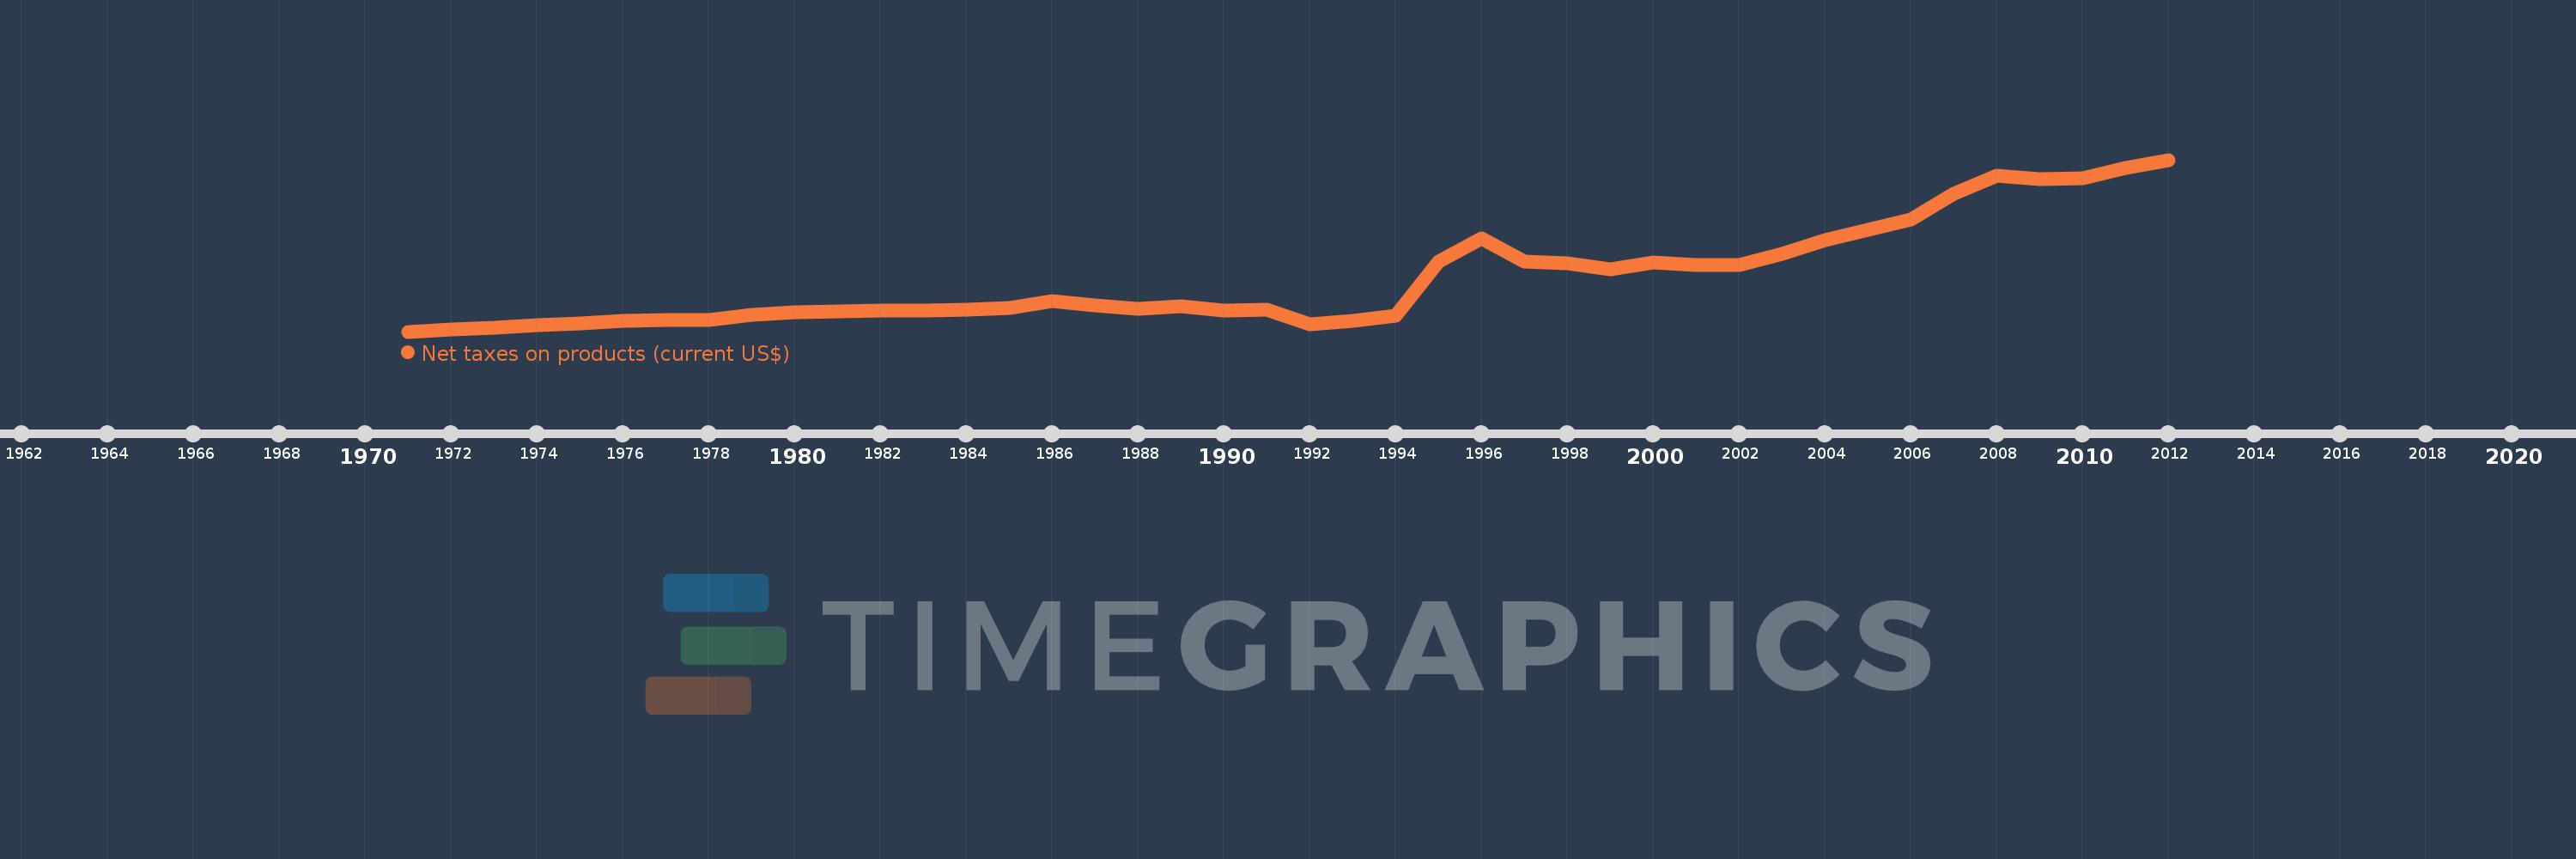
Net taxes on products (current US$)
2012,2011,2010,2009,2008,2007,2006,2005,2004,2003,2002,2001,2000,1999,1998,1997,1996,1995,1994,1993,1992,1991,1990,1989,1988,1987,1986,1985,1984,1983,1982,1981,1980,1979,1978,1977,1976,1975,1974,1973,1972,1971
Cette statistique dans les autres pays:
AfghanistanAlbaniaAlgeriaAndorraAntigua and BarbudaArgentinaArmeniaArubaAustraliaAustriaAzerbaijanBahamas, TheBahrainBangladeshBarbadosBelarusBelgiumBelizeBeninBermudaBhutanBoliviaBosnia and HerzegovinaBotswanaBrazilBulgariaBurkina FasoBurundiCabo VerdeCambodiaCameroonCanadaCentral African RepublicChadChileColombiaCongo, Dem. Rep.Costa RicaCroatiaCubaCyprusCzech RepublicDenmarkDjiboutiDominicaDominican RepublicEcuadorEgypt, Arab Rep.El SalvadorEquatorial GuineaEritreaEstoniaEthiopiaFaroe IslandsFijiFinlandFranceGabonGambia, TheGeorgiaGermanyGhanaGreeceGrenadaGuatemalaGuineaGuinea-BissauGuyanaHondurasHong Kong SAR, ChinaHungaryIndiaIndonesiaIran, Islamic Rep.IrelandItalyJamaicaJapanJordanKazakhstanKenyaKiribatiKorea, Rep.KosovoKyrgyz RepublicLao PDRLatviaLebanonLesothoLiberiaLiechtensteinLithuaniaLuxembourgMacao SAR, ChinaMacedonia, FYRMadagascarMalawiMalaysiaMaldivesMaliMarshall IslandsMauritaniaMauritiusMexicoMicronesia, Fed. Sts.MoldovaMongoliaMontenegroMoroccoMozambiqueNamibiaNepalNetherlandsNew ZealandNicaraguaNigerNigeriaNorwayOmanPakistanPalauPanamaPapua New GuineaParaguayPeruPolandPortugalRomaniaRussian FederationRwandaSao Tome and PrincipeSenegalSerbiaSeychellesSierra LeoneSingaporeSlovak RepublicSloveniaSolomon IslandsSouth AfricaSpainSri LankaSt. Kitts and NevisSt. LuciaSt. Vincent and the GrenadinesSudanSurinameSwazilandSwedenSwitzerlandSyrian Arab RepublicTajikistanTanzaniaThailandTimor-LesteTongaTrinidad and TobagoTunisiaTurkeyTurkmenistanTuvaluUgandaUkraineUnited KingdomUnited StatesUruguayUzbekistanVanuatuVenezuela, RBVietnamWest Bank and GazaYemen, Rep.ZambiaZimbabwe La ligne de temps
Cette échelle de temps montre un graphique de 1971 année à 2012 année Cuba. Les données jusqu'à 1970 année ne sont pas présentés. Quantité d'observations actuelles selon dates: 42.
Source (désignation):
Les indicateurs du développement mondiale
Source (organisation):
World Bank national accounts data, and OECD National Accounts data files.
Catégories:
Economy & Growth
Dernière mise à jour
23 avr. 2017
Les indicateurs de changement de valeurs selon les années
Minimum:
515.675 mln.
1 janv. 1971
Maximum:
11.579 mds
1 janv. 2012
Pour la date d''observation
Valeur
Changement absolu
Le changement par rapport à la valeur précédente
1 janv. 1971
515.675 mln.
+515.675 mln.
0.0%
1 janv. 1972
626.724 mln.
+111.049 mln.
21.53%
1 janv. 1973
737.445 mln.
+110.721 mln.
17.67%
1 janv. 1974
904.616 mln.
+167.171 mln.
22.67%
1 janv. 1975
1.031 mds
+125.981 mln.
13.93%
1 janv. 1976
1.181 mds
+150.823 mln.
14.63%
1 janv. 1977
1.254 mds
+72.325 mln.
6.12%
1 janv. 1978
1.289 mds
+34.896 mln.
2.78%
1 janv. 1979
1.609 mds
+320.804 mln.
24.89%
1 janv. 1980
1.748 mds
+138.888 mln.
8.63%
1 janv. 1981
1.839 mds
+90.486 mln.
5.18%
1 janv. 1982
1.855 mds
+16.662 mln.
0.91%
1 janv. 1983
1.879 mds
+23.244 mln.
1.25%
1 janv. 1984
1.945 mds
+66.504 mln.
3.54%
1 janv. 1985
2.035 mds
+90.195 mln.
4.64%
1 janv. 1986
2.469 mds
+433.249 mln.
21.29%
1 janv. 1987
2.199 mds
-269.466 mln.
-10.92%
1 janv. 1988
1.956 mds
-243.683 mln.
-11.08%
1 janv. 1989
2.122 mds
+166.897 mln.
8.53%
1 janv. 1990
1.892 mds
-230.107 mln.
-10.84%
1 janv. 1991
1.953 mds
+60.961 mln.
3.22%
1 janv. 1992
973.915 mln.
-979.359 mln.
-50.14%
1 janv. 1993
1.188 mds
+214.491 mln.
22.02%
1 janv. 1994
1.513 mds
+324.699 mln.
27.32%
1 janv. 1995
5.002 mds
+3.489 mds
230.57%
1 janv. 1996
6.537 mds
+1.535 mds
30.69%
1 janv. 1997
5.021 mds
-1.516 mds
-23.2%
1 janv. 1998
4.908 mds
-112.8 mln.
-2.25%
1 janv. 1999
4.552 mds
-355.6 mln.
-7.25%
1 janv. 2000
4.943 mds
+390.8 mln.
8.58%
1 janv. 2001
4.81 mds
-133.2 mln.
-2.69%
1 janv. 2002
4.821 mds
+10.8 mln.
0.22%
1 janv. 2003
5.54 mds
+719.3 mln.
14.92%
1 janv. 2004
6.416 mds
+875.7 mln.
15.81%
1 janv. 2005
7.074 mds
+658.3 mln.
10.26%
1 janv. 2006
7.739 mds
+664.7 mln.
9.4%
1 janv. 2007
9.409 mds
+1.67 mds
21.58%
1 janv. 2008
10.531 mds
+1.122 mds
11.93%
1 janv. 2009
10.334 mds
-196.7 mln.
-1.87%
1 janv. 2010
10.362 mds
+27.91 mln.
0.27%
1 janv. 2011
11.077 mds
+714.589 mln.
6.9%
1 janv. 2012
11.579 mds
+501.756 mln.
4.53%
Classement des pays selon les statistiques actuelles par années


Commentaires: