29
/fr/
fr
AIzaSyAYiBZKx7MnpbEhh9jyipgxe19OcubqV5w
April 1, 2024
115578
Cuba
CUB
true
2
1
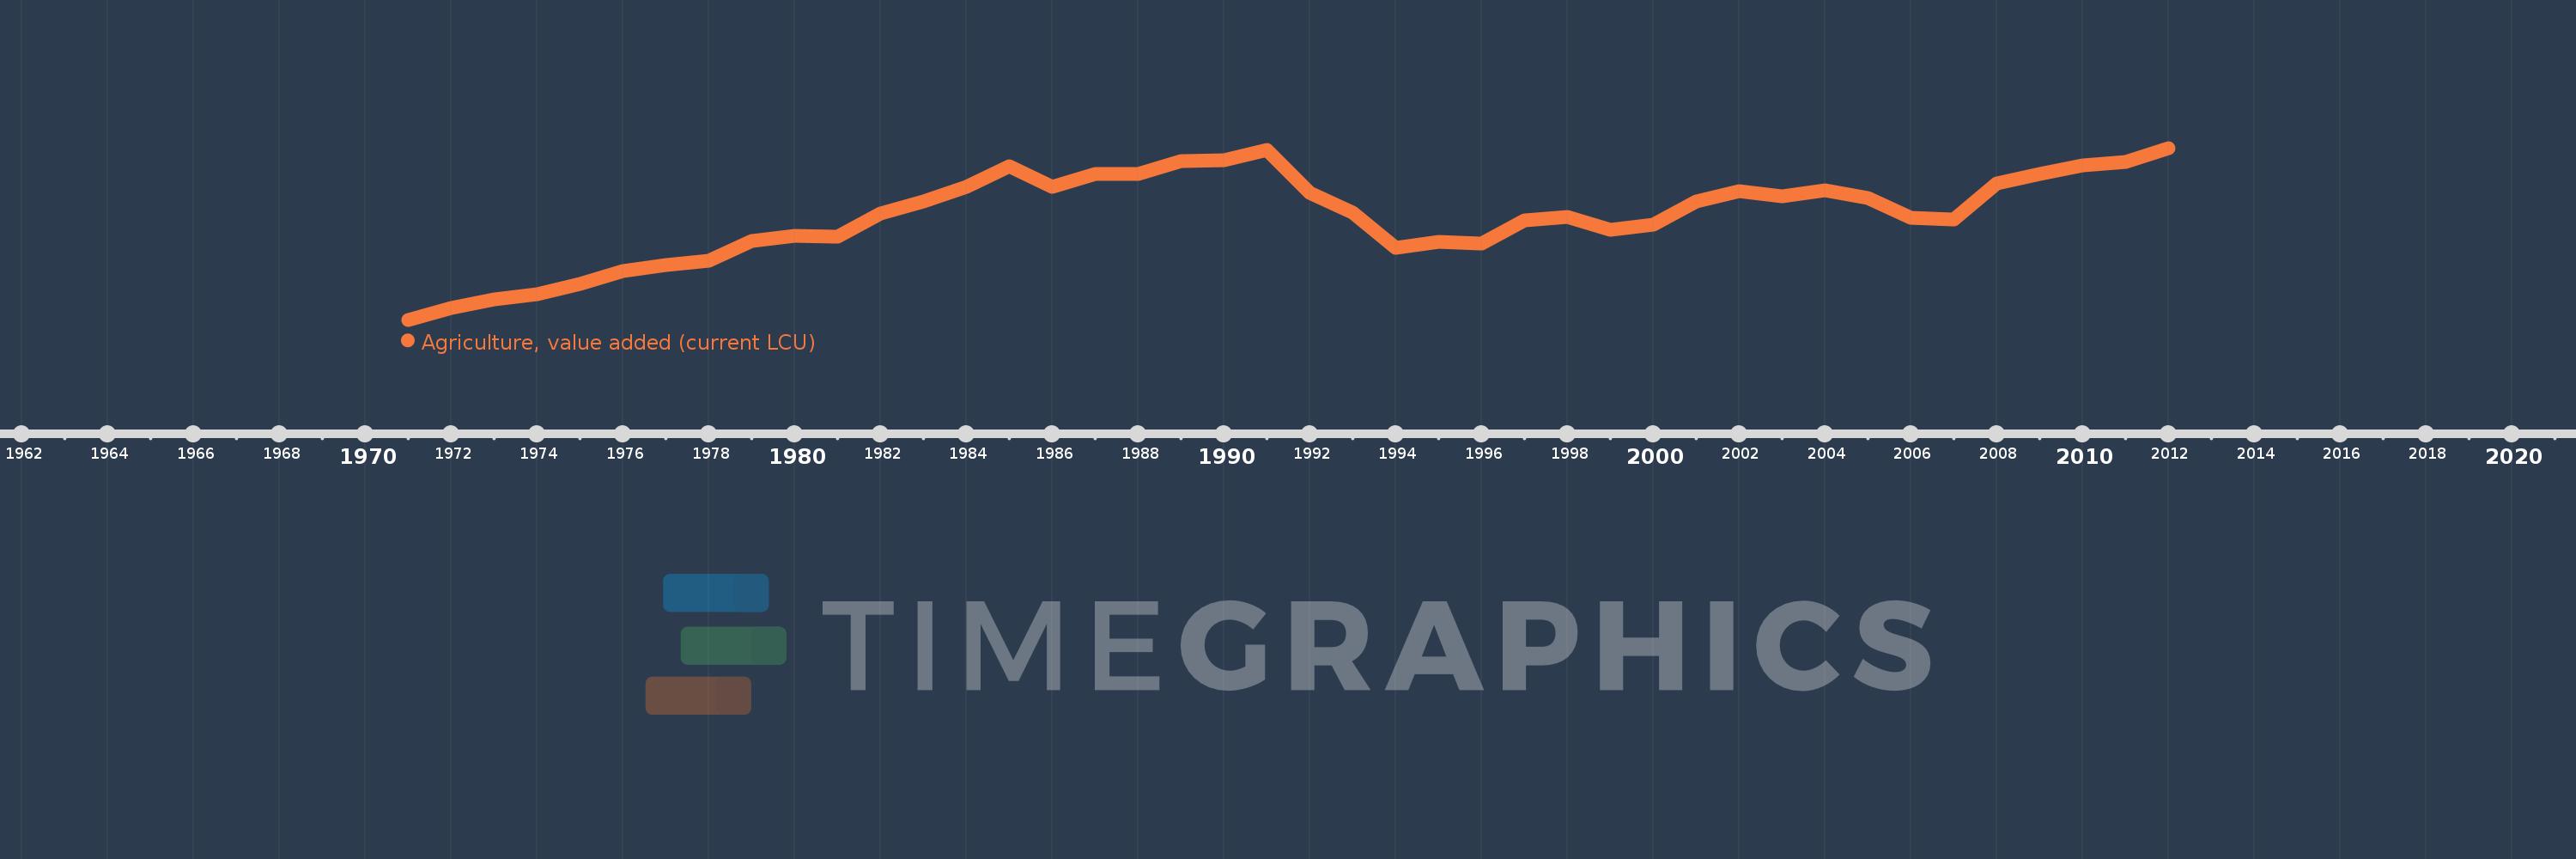
Agriculture, value added (current LCU)
2012,2011,2010,2009,2008,2007,2006,2005,2004,2003,2002,2001,2000,1999,1998,1997,1996,1995,1994,1993,1992,1991,1990,1989,1988,1987,1986,1985,1984,1983,1982,1981,1980,1979,1978,1977,1976,1975,1974,1973,1972,1971
Cette statistique dans les autres pays:
AfghanistanAlbaniaAlgeriaAndorraAngolaAntigua and BarbudaArgentinaArmeniaArubaAustraliaAustriaAzerbaijanBahamas, TheBahrainBangladeshBarbadosBelarusBelgiumBelizeBeninBermudaBhutanBoliviaBosnia and HerzegovinaBotswanaBrazilBrunei DarussalamBulgariaBurkina FasoBurundiCabo VerdeCambodiaCameroonCanadaCayman IslandsCentral African RepublicChadChileChinaColombiaComorosCongo, Dem. Rep.Congo, Rep.Costa RicaCote d'IvoireCroatiaCubaCyprusCzech RepublicDenmarkDjiboutiDominicaDominican RepublicEcuadorEgypt, Arab Rep.El SalvadorEquatorial GuineaEritreaEstoniaEthiopiaFijiFinlandFranceFrench PolynesiaGabonGambia, TheGeorgiaGermanyGhanaGreeceGrenadaGuatemalaGuineaGuinea-BissauGuyanaHondurasHong Kong SAR, ChinaHungaryIcelandIndiaIndonesiaIran, Islamic Rep.IraqIrelandItalyJamaicaJapanJordanKazakhstanKenyaKiribatiKorea, Rep.KosovoKuwaitKyrgyz RepublicLao PDRLatviaLebanonLesothoLiberiaLibyaLithuaniaLuxembourgMacao SAR, ChinaMacedonia, FYRMadagascarMalawiMalaysiaMaldivesMaliMaltaMarshall IslandsMauritaniaMauritiusMexicoMicronesia, Fed. Sts.MoldovaMongoliaMontenegroMoroccoMozambiqueMyanmarNamibiaNepalNetherlandsNew CaledoniaNew ZealandNicaraguaNigerNigeriaNorwayOmanPakistanPalauPanamaPapua New GuineaParaguayPeruPhilippinesPolandPortugalPuerto RicoQatarRomaniaRussian FederationRwandaSamoaSao Tome and PrincipeSaudi ArabiaSenegalSerbiaSeychellesSierra LeoneSingaporeSlovak RepublicSloveniaSolomon IslandsSomaliaSouth AfricaSpainSri LankaSt. Kitts and NevisSt. LuciaSt. Vincent and the GrenadinesSudanSurinameSwazilandSwedenSwitzerlandSyrian Arab RepublicTajikistanTanzaniaThailandTimor-LesteTogoTongaTrinidad and TobagoTunisiaTurkeyTurkmenistanTuvaluUgandaUkraineUnited Arab EmiratesUnited KingdomUnited StatesUruguayUzbekistanVanuatuVenezuela, RBVietnamWest Bank and GazaYemen, Rep.ZambiaZimbabwe La ligne de temps
Cette échelle de temps montre un graphique de 1971 année à 2012 année Cuba. Les données jusqu'à 1970 année ne sont pas présentés. Quantité d'observations actuelles selon dates: 42.
Source (désignation):
Les indicateurs du développement mondiale
Source (organisation):
World Bank national accounts data, and OECD National Accounts data files.
Catégories:
Economy & Growth
Dernière mise à jour
23 avr. 2017
Les indicateurs de changement de valeurs selon les années
Minimum:
690.07 mln.
1 janv. 1971
Maximum:
2.832 mds
1 janv. 2012
Pour la date d''observation
Valeur
Changement absolu
Le changement par rapport à la valeur précédente
1 janv. 1971
690.07 mln.
+690.07 mln.
0.0%
1 janv. 1972
837.99 mln.
+147.921 mln.
21.44%
1 janv. 1973
939.555 mln.
+101.565 mln.
12.12%
1 janv. 1974
1.004 mds
+64.227 mln.
6.84%
1 janv. 1975
1.135 mds
+130.966 mln.
13.05%
1 janv. 1976
1.294 mds
+159.22 mln.
14.03%
1 janv. 1977
1.371 mds
+76.748 mln.
5.93%
1 janv. 1978
1.429 mds
+58.164 mln.
4.24%
1 janv. 1979
1.669 mds
+239.879 mln.
16.79%
1 janv. 1980
1.741 mds
+72.482 mln.
4.34%
1 janv. 1981
1.723 mds
-18.62 mln.
-1.07%
1 janv. 1982
2.02 mds
+297.696 mln.
17.28%
1 janv. 1983
2.168 mds
+147.634 mln.
7.31%
1 janv. 1984
2.342 mds
+173.945 mln.
8.02%
1 janv. 1985
2.609 mds
+266.623 mln.
11.38%
1 janv. 1986
2.35 mds
-258.782 mln.
-9.92%
1 janv. 1987
2.504 mds
+154.708 mln.
6.58%
1 janv. 1988
2.505 mds
+499.864 milles
0.02%
1 janv. 1989
2.665 mds
+160.456 mln.
6.41%
1 janv. 1990
2.682 mds
+16.995 mln.
0.64%
1 janv. 1991
2.809 mds
+126.716 mln.
4.72%
1 janv. 1992
2.276 mds
-532.855 mln.
-18.97%
1 janv. 1993
2.031 mds
-245.308 mln.
-10.78%
1 janv. 1994
1.584 mds
-446.754 mln.
-22.0%
1 janv. 1995
1.663 mds
+78.854 mln.
4.98%
1 janv. 1996
1.641 mds
-22.369 mln.
-1.35%
1 janv. 1997
1.935 mds
+293.92 mln.
17.91%
1 janv. 1998
1.972 mds
+37.8 mln.
1.95%
1 janv. 1999
1.815 mds
-156.9 mln.
-7.95%
1 janv. 2000
1.874 mds
+58.7 mln.
3.23%
1 janv. 2001
2.166 mds
+292.1 mln.
15.59%
1 janv. 2002
2.292 mds
+125.9 mln.
5.81%
1 janv. 2003
2.225 mds
-66.7 mln.
-2.91%
1 janv. 2004
2.299 mds
+73.4 mln.
3.3%
1 janv. 2005
2.209 mds
-89.5 mln.
-3.89%
1 janv. 2006
1.963 mds
-246.7 mln.
-11.17%
1 janv. 2007
1.943 mds
-19.5 mln.
-0.99%
1 janv. 2008
2.389 mds
+446.2 mln.
22.96%
1 janv. 2009
2.503 mds
+113.4 mln.
4.75%
1 janv. 2010
2.61 mds
+106.9 mln.
4.27%
1 janv. 2011
2.658 mds
+48.582 mln.
1.86%
1 janv. 2012
2.832 mds
+173.94 mln.
6.54%
Classement des pays selon les statistiques actuelles par années


Commentaires: