29
/fr/
fr
AIzaSyAYiBZKx7MnpbEhh9jyipgxe19OcubqV5w
April 1, 2024
113639
Cote d'Ivoire
CIV
true
2
1
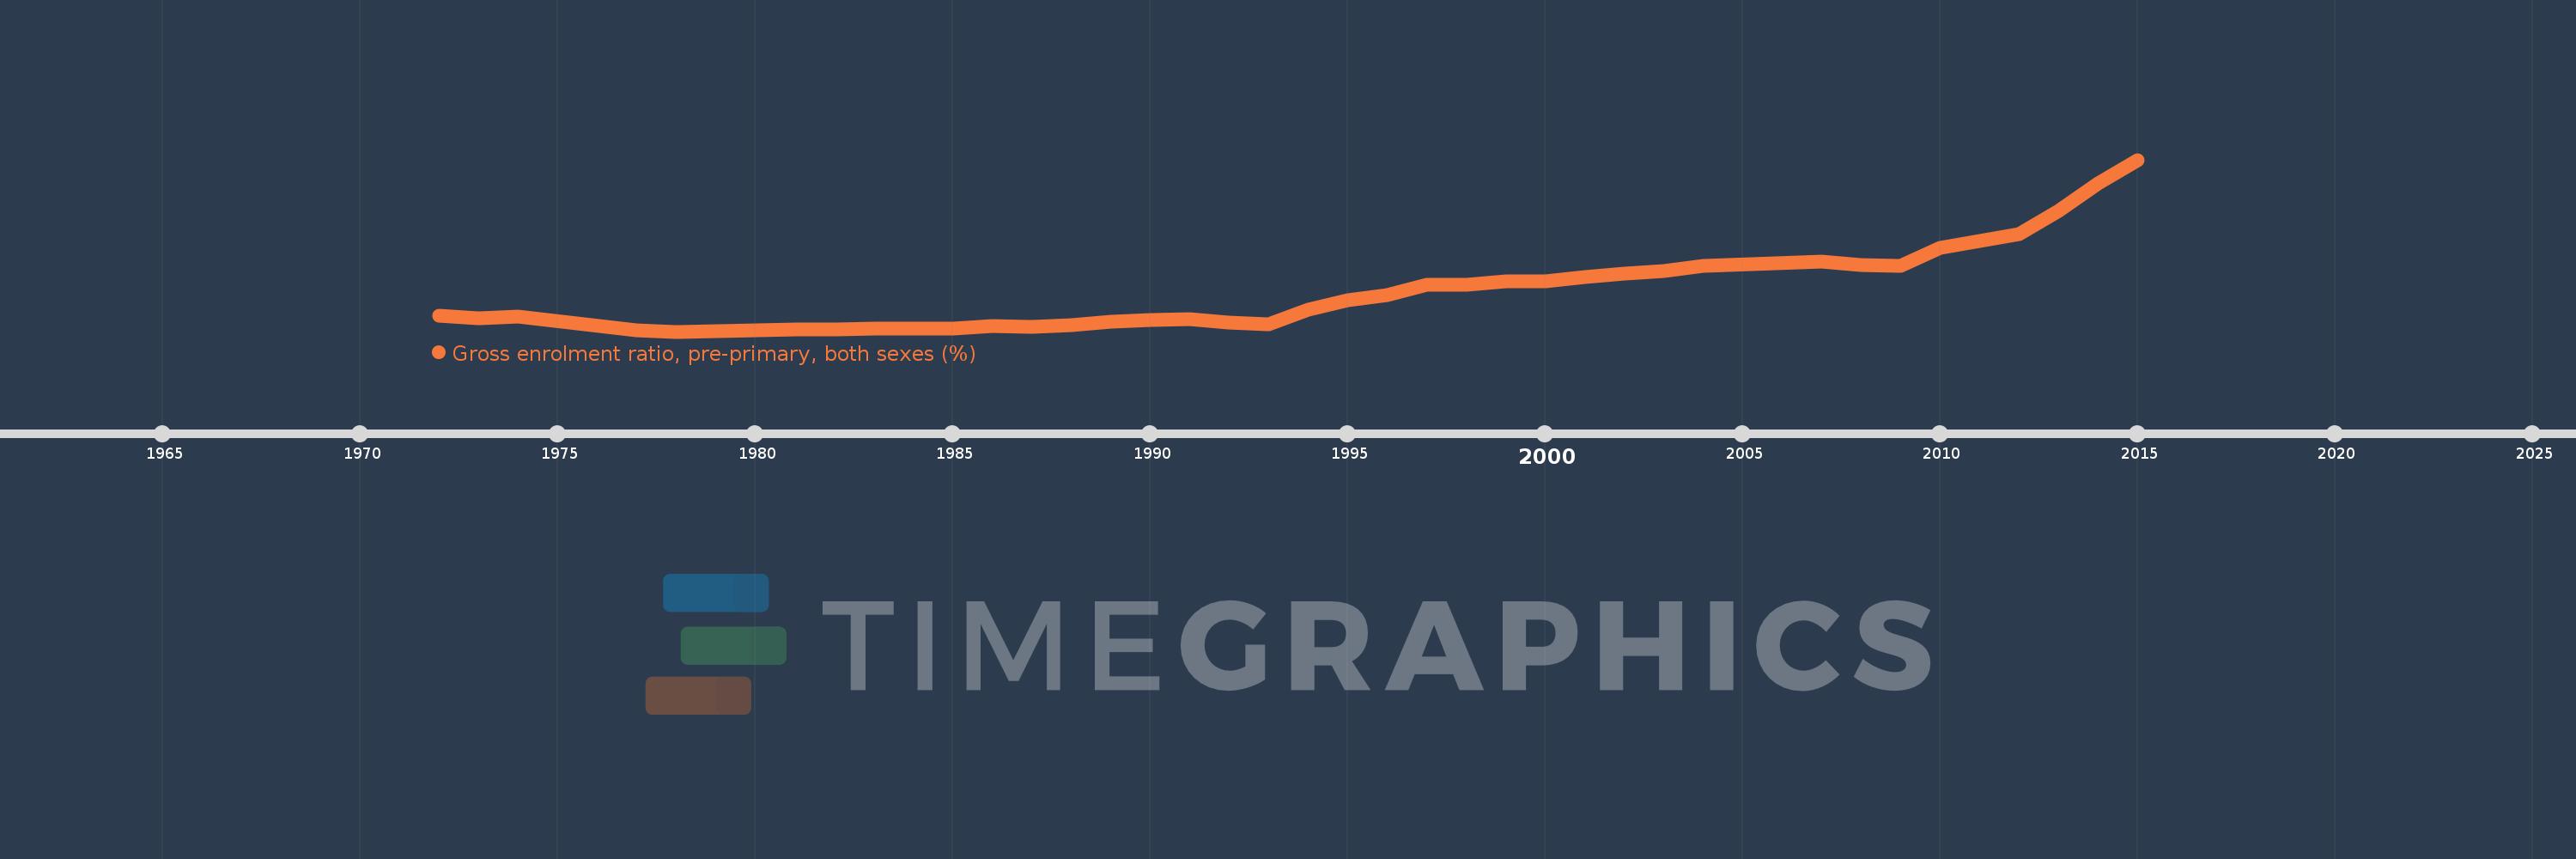
Gross enrolment ratio, pre-primary, both sexes (%)
2015,2014,2013,2012,2010,2009,2008,2007,2004,2003,2002,2001,2000,1999,1998,1997,1996,1995,1994,1993,1992,1991,1990,1989,1988,1987,1986,1985,1984,1983,1982,1981,1980,1979,1978,1977,1974,1973,1972
Cette statistique dans les autres pays:
AfghanistanAlbaniaAlgeriaAndorraAngolaAntigua and BarbudaArab WorldArgentinaArmeniaArubaAustraliaAustriaAzerbaijanBahamas, TheBahrainBangladeshBarbadosBelarusBelgiumBelizeBeninBermudaBhutanBoliviaBosnia and HerzegovinaBotswanaBrazilBritish Virgin IslandsBrunei DarussalamBulgariaBurkina FasoBurundiCabo VerdeCambodiaCameroonCanadaCaribbean small statesCentral African RepublicCentral Europe and the BalticsChadChileChinaColombiaComorosCongo, Dem. Rep.Congo, Rep.Costa RicaCote d'IvoireCroatiaCubaCyprusCzech RepublicDenmarkDjiboutiDominicaDominican RepublicEarly-demographic dividendEast Asia & PacificEast Asia & Pacific (excluding high income)East Asia & Pacific (IDA & IBRD countries)EcuadorEgypt, Arab Rep.El SalvadorEquatorial GuineaEritreaEstoniaEthiopiaEuro areaEurope & Central AsiaEurope & Central Asia (excluding high income)Europe & Central Asia (IDA & IBRD countries)European UnionFijiFinlandFragile and conflict affected situationsFranceGabonGambia, TheGeorgiaGermanyGhanaGreeceGrenadaGuatemalaGuineaGuinea-BissauGuyanaHaitiHeavily indebted poor countries (HIPC)High incomeHondurasHong Kong SAR, ChinaHungaryIBRD onlyIcelandIDA & IBRD totalIDA blendIDA onlyIDA totalIndiaIndonesiaIran, Islamic Rep.IraqIrelandIsraelItalyJamaicaJapanJordanKazakhstanKenyaKiribatiKorea, Dem. People’s Rep.Korea, Rep.KuwaitKyrgyz RepublicLao PDRLate-demographic dividendLatin America & Caribbean Latin America & Caribbean (excluding high income)Latin America & the Caribbean (IDA & IBRD countries)LatviaLeast developed countries: UN classificationLebanonLesothoLiberiaLibyaLiechtensteinLithuaniaLow & middle incomeLow incomeLower middle incomeLuxembourgMacao SAR, ChinaMacedonia, FYRMadagascarMalaysiaMaldivesMaliMaltaMarshall IslandsMauritaniaMauritiusMexicoMicronesia, Fed. Sts.Middle East & North AfricaMiddle East & North Africa (excluding high income)Middle East & North Africa (IDA & IBRD countries)Middle incomeMoldovaMongoliaMontenegroMoroccoMozambiqueMyanmarNamibiaNauruNepalNetherlandsNew ZealandNicaraguaNigerNigeriaNorth AmericaNorwayOECD membersOmanOther small statesPacific island small statesPakistanPalauPanamaPapua New GuineaParaguayPeruPhilippinesPolandPortugalPost-demographic dividendPre-demographic dividendPuerto RicoQatarRomaniaRussian FederationRwandaSamoaSan MarinoSao Tome and PrincipeSaudi ArabiaSenegalSerbiaSeychellesSierra LeoneSlovak RepublicSloveniaSmall statesSolomon IslandsSomaliaSouth AfricaSouth AsiaSouth Asia (IDA & IBRD)South SudanSpainSri LankaSt. Kitts and NevisSt. LuciaSt. Vincent and the GrenadinesSub-Saharan Africa Sub-Saharan Africa (excluding high income)Sub-Saharan Africa (IDA & IBRD countries)SudanSurinameSwazilandSwedenSwitzerlandSyrian Arab RepublicTajikistanTanzaniaThailandTimor-LesteTogoTongaTrinidad and TobagoTunisiaTurkeyTurkmenistanTuvaluUgandaUkraineUnited Arab EmiratesUnited KingdomUnited StatesUpper middle incomeUruguayUzbekistanVanuatuVenezuela, RBVietnamWest Bank and GazaWorldYemen, Rep.ZambiaZimbabwe La ligne de temps
Cette échelle de temps montre un graphique de 1972 année à 2015 année Cote d'Ivoire. Les données jusqu'à 1971 année ne sont pas présentés. Quantité d'observations actuelles selon dates: 39.
Source (désignation):
Les indicateurs du développement mondiale
Source (organisation):
UNESCO Institute for Statistics
Catégories:
Education
Dernière mise à jour
23 avr. 2017
Les indicateurs de changement de valeurs selon les années
Minimum:
0.649
1 janv. 1978
Maximum:
6.554
1 janv. 2015
Pour la date d''observation
Valeur
Changement absolu
Le changement par rapport à la valeur précédente
1 janv. 1972
1.188
+1.188
0.0%
1 janv. 1973
1.106
-0.082
-6.9%
1 janv. 1974
1.179
+0.073
6.56%
1 janv. 1977
0.68
-0.499
-42.31%
1 janv. 1978
0.649
-0.031
-4.61%
1 janv. 1979
0.67
+0.021
3.29%
1 janv. 1980
0.69
+0.02
3.02%
1 janv. 1981
0.737
+0.047
6.75%
1 janv. 1982
0.731
-0.006
-0.84%
1 janv. 1983
0.764
+0.033
4.52%
1 janv. 1984
0.765
+0.002
0.22%
1 janv. 1985
0.766
+0.0
0.03%
1 janv. 1986
0.845
+0.079
10.35%
1 janv. 1987
0.823
-0.022
-2.64%
1 janv. 1988
0.879
+0.056
6.8%
1 janv. 1989
0.992
+0.113
12.9%
1 janv. 1990
1.054
+0.062
6.26%
1 janv. 1991
1.073
+0.019
1.77%
1 janv. 1992
0.972
-0.101
-9.4%
1 janv. 1993
0.91
-0.062
-6.35%
1 janv. 1994
1.414
+0.504
55.38%
1 janv. 1995
1.72
+0.305
21.6%
1 janv. 1996
1.912
+0.192
11.18%
1 janv. 1997
2.244
+0.332
17.37%
1 janv. 1998
2.263
+0.019
0.85%
1 janv. 1999
2.386
+0.122
5.41%
1 janv. 2000
2.363
-0.023
-0.95%
1 janv. 2001
2.524
+0.162
6.84%
1 janv. 2002
2.636
+0.112
4.42%
1 janv. 2003
2.734
+0.098
3.72%
1 janv. 2004
2.917
+0.182
6.67%
1 janv. 2007
3.052
+0.136
4.65%
1 janv. 2008
2.932
-0.121
-3.96%
1 janv. 2009
2.914
-0.017
-0.6%
1 janv. 2010
3.513
+0.599
20.54%
1 janv. 2012
4.012
+0.499
14.2%
1 janv. 2013
4.787
+0.775
19.32%
1 janv. 2014
5.741
+0.955
19.94%
1 janv. 2015
6.554
+0.813
14.15%
Classement des pays selon les statistiques actuelles par années


Commentaires: