29
/fr/
fr
AIzaSyAYiBZKx7MnpbEhh9jyipgxe19OcubqV5w
April 1, 2024
111622
Congo, Rep.
COG
true
2
1
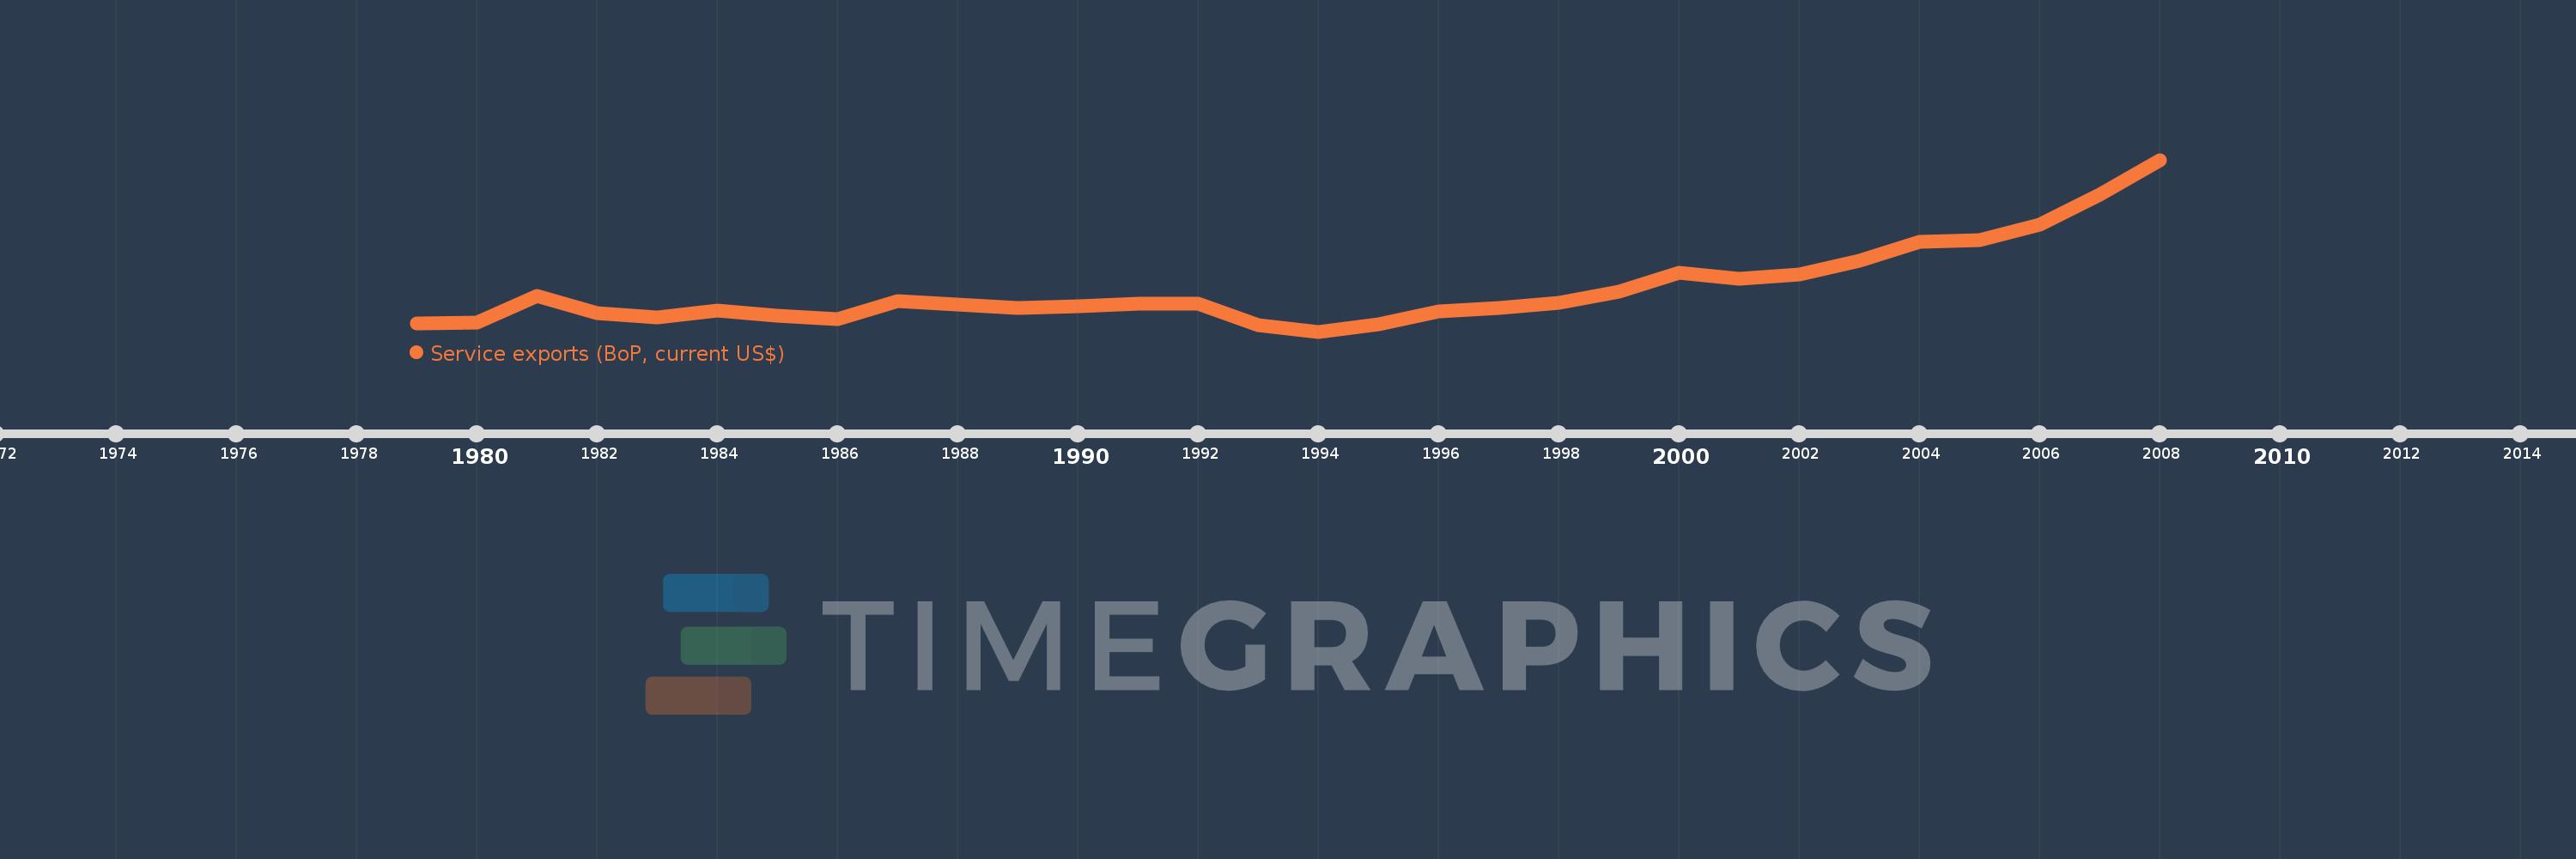
Service exports (BoP, current US$)
2008,2007,2006,2005,2004,2003,2002,2001,2000,1999,1998,1997,1996,1995,1994,1993,1992,1991,1990,1989,1988,1987,1986,1985,1984,1983,1982,1981,1980,1979
Cette statistique dans les autres pays:
AfghanistanAlbaniaAlgeriaAngolaAntigua and BarbudaArab WorldArgentinaArmeniaArubaAustraliaAustriaAzerbaijanBahamas, TheBahrainBangladeshBarbadosBelarusBelgiumBelizeBeninBermudaBhutanBoliviaBosnia and HerzegovinaBotswanaBrazilBrunei DarussalamBulgariaBurkina FasoBurundiCabo VerdeCambodiaCameroonCanadaCaribbean small statesCentral African RepublicCentral Europe and the BalticsChadChileChinaColombiaComorosCongo, Dem. Rep.Congo, Rep.Costa RicaCote d'IvoireCroatiaCuracaoCyprusCzech RepublicDenmarkDjiboutiDominicaDominican RepublicEarly-demographic dividendEast Asia & PacificEast Asia & Pacific (excluding high income)East Asia & Pacific (IDA & IBRD countries)EcuadorEgypt, Arab Rep.El SalvadorEquatorial GuineaEritreaEstoniaEthiopiaEuro areaEurope & Central AsiaEurope & Central Asia (excluding high income)Europe & Central Asia (IDA & IBRD countries)European UnionFaroe IslandsFijiFinlandFragile and conflict affected situationsFranceFrench PolynesiaGabonGambia, TheGeorgiaGermanyGhanaGreeceGrenadaGuatemalaGuineaGuinea-BissauGuyanaHaitiHeavily indebted poor countries (HIPC)High incomeHondurasHong Kong SAR, ChinaHungaryIBRD onlyIcelandIDA & IBRD totalIDA blendIDA onlyIDA totalIndiaIndonesiaIran, Islamic Rep.IraqIrelandIsraelItalyJamaicaJapanJordanKazakhstanKenyaKiribatiKorea, Rep.KosovoKuwaitKyrgyz RepublicLao PDRLate-demographic dividendLatin America & Caribbean Latin America & Caribbean (excluding high income)Latin America & the Caribbean (IDA & IBRD countries)LatviaLeast developed countries: UN classificationLebanonLesothoLiberiaLibyaLithuaniaLow & middle incomeLow incomeLower middle incomeLuxembourgMacao SAR, ChinaMacedonia, FYRMadagascarMalawiMalaysiaMaldivesMaliMaltaMarshall IslandsMauritaniaMauritiusMexicoMicronesia, Fed. Sts.Middle East & North Africa (excluding high income)Middle East & North Africa (IDA & IBRD countries)Middle incomeMoldovaMongoliaMontenegroMoroccoMozambiqueMyanmarNamibiaNepalNetherlandsNew CaledoniaNew ZealandNicaraguaNigerNigeriaNorth AmericaNorwayOECD membersOmanPacific island small statesPakistanPalauPanamaPapua New GuineaParaguayPeruPhilippinesPolandPortugalPost-demographic dividendPre-demographic dividendQatarRomaniaRussian FederationRwandaSamoaSao Tome and PrincipeSaudi ArabiaSenegalSerbiaSeychellesSierra LeoneSingaporeSint Maarten (Dutch part)Slovak RepublicSloveniaSolomon IslandsSouth AfricaSouth AsiaSouth Asia (IDA & IBRD)South SudanSpainSri LankaSt. Kitts and NevisSt. LuciaSt. Vincent and the GrenadinesSub-Saharan Africa Sub-Saharan Africa (excluding high income)Sub-Saharan Africa (IDA & IBRD countries)SudanSurinameSwazilandSwedenSwitzerlandSyrian Arab RepublicTajikistanTanzaniaThailandTimor-LesteTogoTongaTrinidad and TobagoTunisiaTurkeyTuvaluUgandaUkraineUnited KingdomUnited StatesUpper middle incomeUruguayVanuatuVenezuela, RBVietnamWest Bank and GazaWorldYemen, Rep.ZambiaZimbabwe La ligne de temps
Cette échelle de temps montre un graphique de 1979 année à 2008 année Congo, Rep.. Les données jusqu'à 1978 année ne sont pas présentés. Quantité d'observations actuelles selon dates: 30.
Source (désignation):
Les indicateurs du développement mondiale
Source (organisation):
International Monetary Fund, Balance of Payments Statistics Yearbook and data files.
Catégories:
Economy & Growth, Trade
Dernière mise à jour
23 avr. 2017
Les indicateurs de changement de valeurs selon les années
Minimum:
56.151 mln.
1 janv. 1994
Maximum:
319.446 mln.
1 janv. 2008
Pour la date d''observation
Valeur
Changement absolu
Le changement par rapport à la valeur précédente
1 janv. 1979
68.777 mln.
+68.777 mln.
0.0%
1 janv. 1980
69.734 mln.
+957.027 milles
1.39%
1 janv. 1981
110.621 mln.
+40.887 mln.
58.63%
1 janv. 1982
84.017 mln.
-26.604 mln.
-24.05%
1 janv. 1983
77.6 mln.
-6.416 mln.
-7.64%
1 janv. 1984
87.756 mln.
+10.156 mln.
13.09%
1 janv. 1985
80.301 mln.
-7.456 mln.
-8.5%
1 janv. 1986
74.693 mln.
-5.607 mln.
-6.98%
1 janv. 1987
103.111 mln.
+28.418 mln.
38.05%
1 janv. 1988
97.163 mln.
-5.948 mln.
-5.77%
1 janv. 1989
92.275 mln.
-4.888 mln.
-5.03%
1 janv. 1990
95.295 mln.
+3.02 mln.
3.27%
1 janv. 1991
99.168 mln.
+3.873 mln.
4.06%
1 janv. 1992
99.253 mln.
+84.985 milles
0.09%
1 janv. 1993
66.115 mln.
-33.139 mln.
-33.39%
1 janv. 1994
56.151 mln.
-9.963 mln.
-15.07%
1 janv. 1995
67.002 mln.
+10.851 mln.
19.32%
1 janv. 1996
87.421 mln.
+20.419 mln.
30.47%
1 janv. 1997
91.871 mln.
+4.45 mln.
5.09%
1 janv. 1998
99.676 mln.
+7.805 mln.
8.5%
1 janv. 1999
117.627 mln.
+17.95 mln.
18.01%
1 janv. 2000
146.031 mln.
+28.404 mln.
24.15%
1 janv. 2001
136.512 mln.
-9.519 mln.
-6.52%
1 janv. 2002
143.846 mln.
+7.335 mln.
5.37%
1 janv. 2003
164.798 mln.
+20.951 mln.
14.56%
1 janv. 2004
194.081 mln.
+29.283 mln.
17.77%
1 janv. 2005
196.674 mln.
+2.593 mln.
1.34%
1 janv. 2006
220.487 mln.
+23.813 mln.
12.11%
1 janv. 2007
266.021 mln.
+45.534 mln.
20.65%
1 janv. 2008
319.446 mln.
+53.425 mln.
20.08%
Classement des pays selon les statistiques actuelles par années


Commentaires: