29
/fr/
fr
AIzaSyAYiBZKx7MnpbEhh9jyipgxe19OcubqV5w
April 1, 2024
108521
Comoros
COM
true
2
1
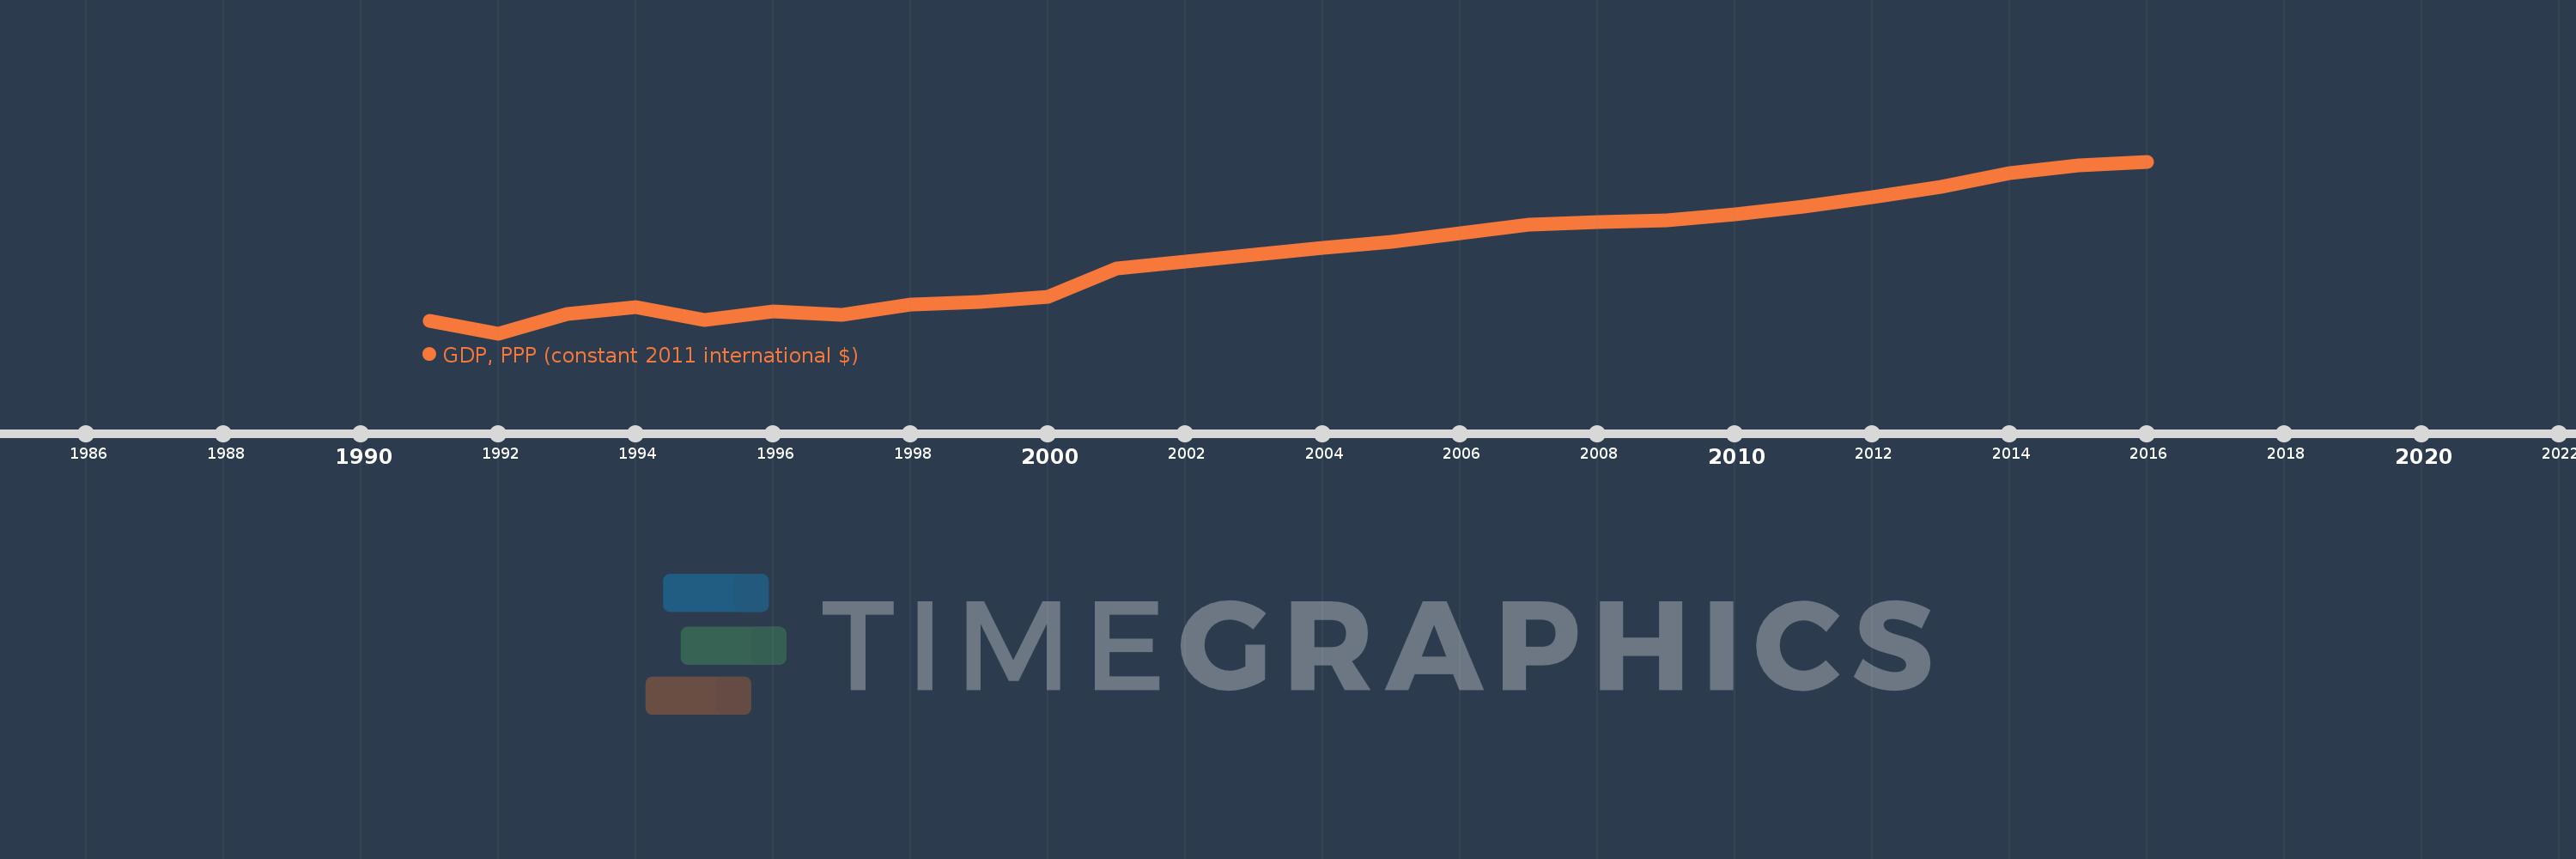
GDP, PPP (constant 2011 international $)
2016,2015,2014,2013,2012,2011,2010,2009,2008,2007,2006,2005,2004,2003,2002,2001,2000,1999,1998,1997,1996,1995,1994,1993,1992,1991
Cette statistique dans les autres pays:
AfghanistanAlbaniaAlgeriaAngolaAntigua and BarbudaArab WorldArgentinaArmeniaArubaAustraliaAustriaAzerbaijanBahamas, TheBahrainBangladeshBarbadosBelarusBelgiumBelizeBeninBermudaBhutanBoliviaBosnia and HerzegovinaBotswanaBrazilBrunei DarussalamBulgariaBurkina FasoBurundiCabo VerdeCambodiaCameroonCanadaCaribbean small statesCayman IslandsCentral African RepublicCentral Europe and the BalticsChadChileChinaColombiaComorosCongo, Dem. Rep.Congo, Rep.Costa RicaCote d'IvoireCroatiaCubaCyprusCzech RepublicDenmarkDjiboutiDominicaDominican RepublicEarly-demographic dividendEast Asia & PacificEast Asia & Pacific (excluding high income)East Asia & Pacific (IDA & IBRD countries)EcuadorEgypt, Arab Rep.El SalvadorEquatorial GuineaEritreaEstoniaEthiopiaEuro areaEurope & Central AsiaEurope & Central Asia (excluding high income)Europe & Central Asia (IDA & IBRD countries)European UnionFijiFinlandFragile and conflict affected situationsFranceGabonGambia, TheGeorgiaGermanyGhanaGreeceGrenadaGuatemalaGuineaGuinea-BissauGuyanaHaitiHeavily indebted poor countries (HIPC)High incomeHondurasHong Kong SAR, ChinaHungaryIBRD onlyIcelandIDA & IBRD totalIDA blendIDA onlyIDA totalIndiaIndonesiaIran, Islamic Rep.IraqIrelandIsraelItalyJamaicaJapanJordanKazakhstanKenyaKiribatiKorea, Rep.KosovoKuwaitKyrgyz RepublicLao PDRLate-demographic dividendLatin America & Caribbean Latin America & Caribbean (excluding high income)Latin America & the Caribbean (IDA & IBRD countries)LatviaLeast developed countries: UN classificationLebanonLesothoLiberiaLibyaLithuaniaLow & middle incomeLow incomeLower middle incomeLuxembourgMacao SAR, ChinaMacedonia, FYRMadagascarMalawiMalaysiaMaldivesMaliMaltaMarshall IslandsMauritaniaMauritiusMexicoMicronesia, Fed. Sts.Middle East & North AfricaMiddle East & North Africa (excluding high income)Middle East & North Africa (IDA & IBRD countries)Middle incomeMoldovaMongoliaMontenegroMoroccoMozambiqueMyanmarNamibiaNauruNepalNetherlandsNew ZealandNicaraguaNigerNigeriaNorth AmericaNorwayOECD membersOmanOther small statesPacific island small statesPakistanPalauPanamaPapua New GuineaParaguayPeruPhilippinesPolandPortugalPost-demographic dividendPre-demographic dividendPuerto RicoQatarRomaniaRussian FederationRwandaSamoaSao Tome and PrincipeSaudi ArabiaSenegalSerbiaSeychellesSierra LeoneSingaporeSint Maarten (Dutch part)Slovak RepublicSloveniaSmall statesSolomon IslandsSouth AfricaSouth AsiaSouth Asia (IDA & IBRD)South SudanSpainSri LankaSt. Kitts and NevisSt. LuciaSt. Vincent and the GrenadinesSub-Saharan Africa Sub-Saharan Africa (excluding high income)Sub-Saharan Africa (IDA & IBRD countries)SudanSurinameSwazilandSwedenSwitzerlandTajikistanTanzaniaThailandTimor-LesteTogoTongaTrinidad and TobagoTunisiaTurkeyTurkmenistanTuvaluUgandaUkraineUnited Arab EmiratesUnited KingdomUnited StatesUpper middle incomeUruguayUzbekistanVanuatuVenezuela, RBVietnamWest Bank and GazaWorldYemen, Rep.ZambiaZimbabwe La ligne de temps
Cette échelle de temps montre un graphique de 1991 année à 2016 année Comoros. Les données jusqu'à 1990 année ne sont pas présentés. Quantité d'observations actuelles selon dates: 26.
Source (désignation):
Les indicateurs du développement mondiale
Source (organisation):
World Bank, International Comparison Program database.
Catégories:
Economy & Growth
Dernière mise à jour
23 avr. 2017
Les indicateurs de changement de valeurs selon les années
Minimum:
622.999 mln.
1 janv. 1992
Maximum:
1.099 mds
1 janv. 2016
Pour la date d''observation
Valeur
Changement absolu
Le changement par rapport à la valeur précédente
1 janv. 1991
658.53 mln.
+658.53 mln.
0.0%
1 janv. 1992
622.999 mln.
-35.532 mln.
-5.4%
1 janv. 1993
676.146 mln.
+53.148 mln.
8.53%
1 janv. 1994
696.471 mln.
+20.325 mln.
3.01%
1 janv. 1995
659.72 mln.
-36.751 mln.
-5.28%
1 janv. 1996
683.537 mln.
+23.817 mln.
3.61%
1 janv. 1997
674.708 mln.
-8.829 mln.
-1.29%
1 janv. 1998
701.901 mln.
+27.193 mln.
4.03%
1 janv. 1999
710.904 mln.
+9.003 mln.
1.28%
1 janv. 2000
724.583 mln.
+13.679 mln.
1.92%
1 janv. 2001
803.186 mln.
+78.603 mln.
10.85%
1 janv. 2002
821.924 mln.
+18.738 mln.
2.33%
1 janv. 2003
841.032 mln.
+19.108 mln.
2.32%
1 janv. 2004
858.728 mln.
+17.696 mln.
2.1%
1 janv. 2005
875.212 mln.
+16.484 mln.
1.92%
1 janv. 2006
900.045 mln.
+24.833 mln.
2.84%
1 janv. 2007
923.869 mln.
+23.823 mln.
2.65%
1 janv. 2008
931.261 mln.
+7.392 mln.
0.8%
1 janv. 2009
934.989 mln.
+3.728 mln.
0.4%
1 janv. 2010
953.221 mln.
+18.232 mln.
1.95%
1 janv. 2011
974.192 mln.
+20.971 mln.
2.2%
1 janv. 2012
999.521 mln.
+25.329 mln.
2.6%
1 janv. 2013
1.03 mds
+29.986 mln.
3.0%
1 janv. 2014
1.066 mds
+36.033 mln.
3.5%
1 janv. 2015
1.088 mds
+21.968 mln.
2.06%
1 janv. 2016
1.099 mds
+11.039 mln.
1.02%
Classement des pays selon les statistiques actuelles par années


Commentaires: