29
/fr/
fr
AIzaSyAYiBZKx7MnpbEhh9jyipgxe19OcubqV5w
April 1, 2024
101423
Canada
CAN
true
2
1
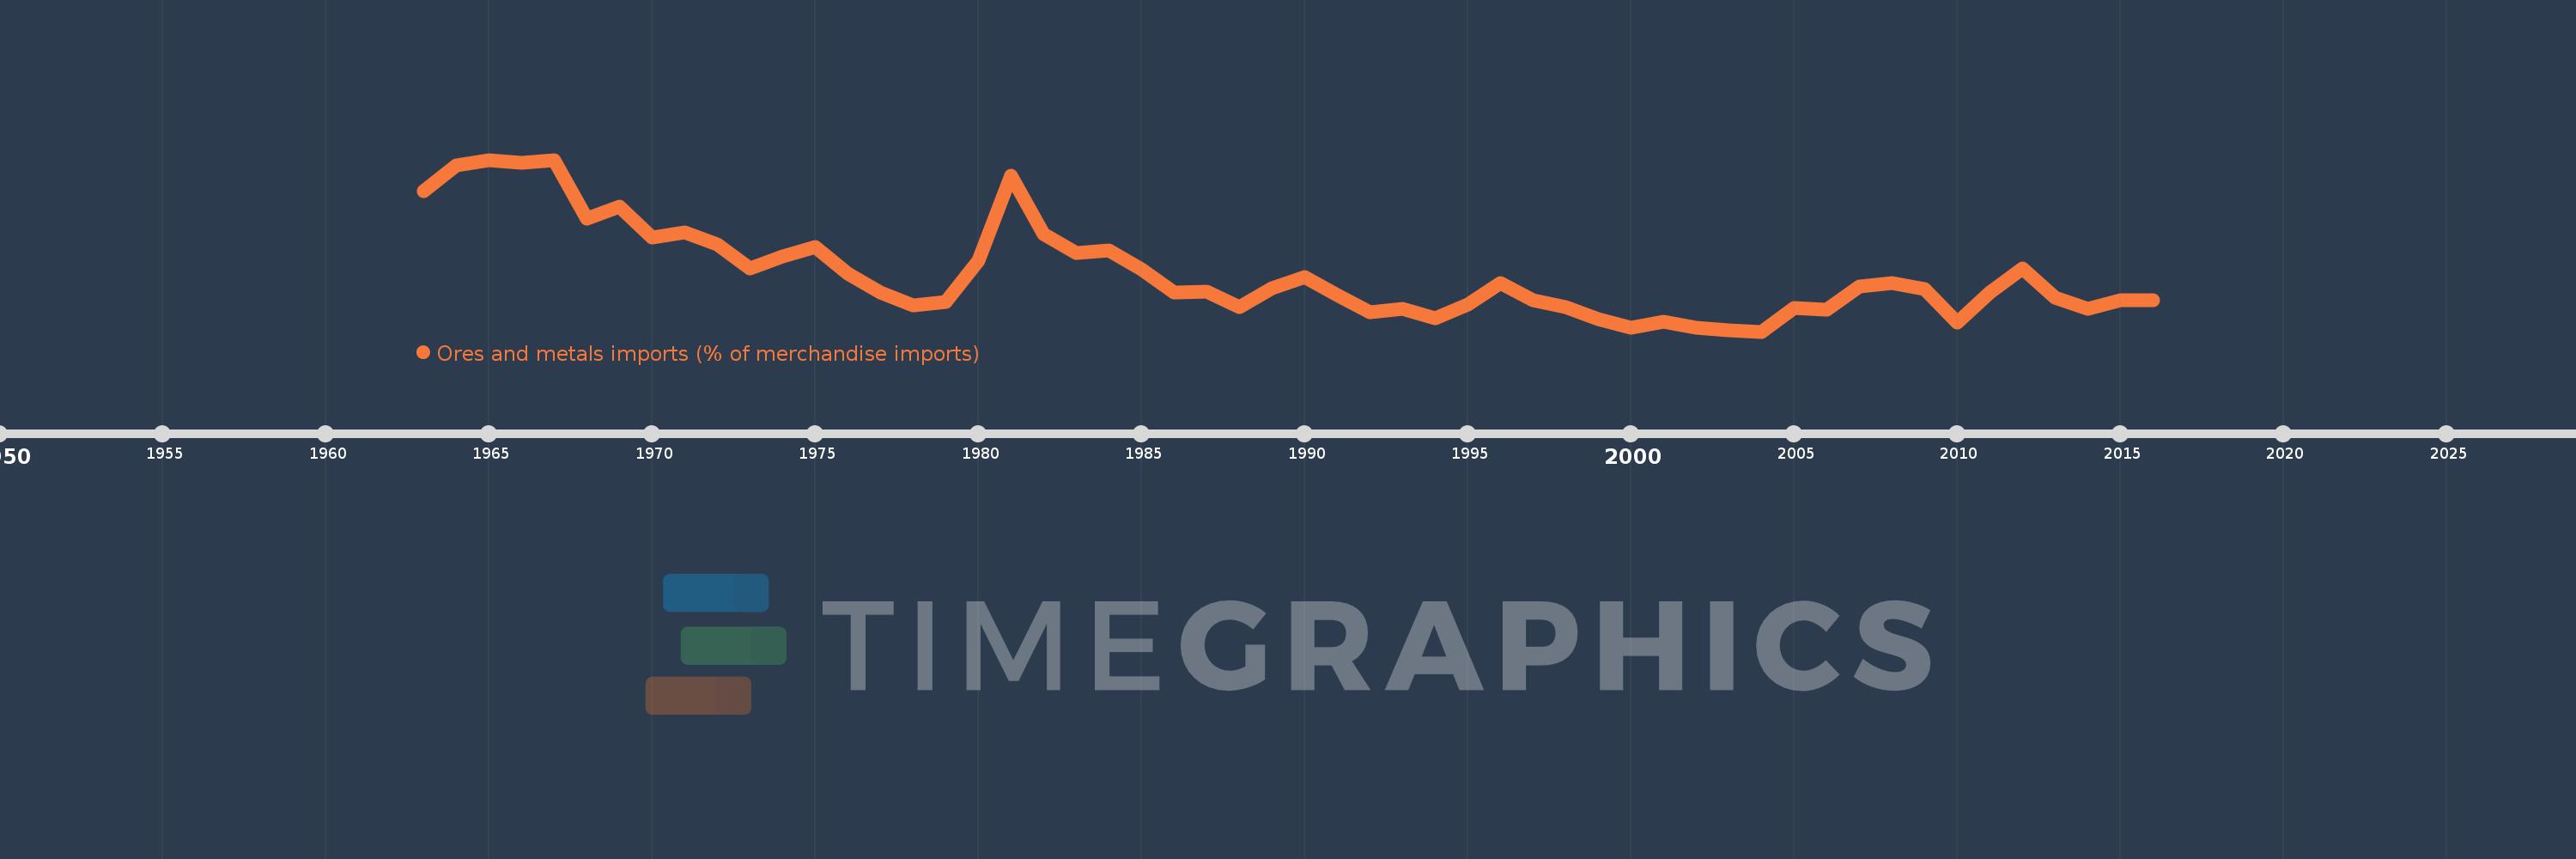
Ores and metals imports (% of merchandise imports)
2016,2015,2014,2013,2012,2011,2010,2009,2008,2007,2006,2005,2004,2003,2002,2001,2000,1999,1998,1997,1996,1995,1994,1993,1992,1991,1990,1989,1988,1987,1986,1985,1984,1983,1982,1981,1980,1979,1978,1977,1976,1975,1974,1973,1972,1971,1970,1969,1968,1967,1966,1965,1964,1963
Cette statistique dans les autres pays:
AfghanistanAlbaniaAlgeriaAndorraAngolaAntigua and BarbudaArab WorldArgentinaArmeniaArubaAustraliaAustriaAzerbaijanBahamas, TheBahrainBangladeshBarbadosBelarusBelgiumBelizeBeninBermudaBhutanBoliviaBosnia and HerzegovinaBotswanaBrazilBrunei DarussalamBulgariaBurkina FasoBurundiCabo VerdeCambodiaCameroonCanadaCaribbean small statesCayman IslandsCentral African RepublicCentral Europe and the BalticsChadChileChinaColombiaComorosCongo, Dem. Rep.Congo, Rep.Costa RicaCote d'IvoireCroatiaCubaCyprusCzech RepublicDenmarkDjiboutiDominicaDominican RepublicEarly-demographic dividendEast Asia & PacificEast Asia & Pacific (excluding high income)East Asia & Pacific (IDA & IBRD countries)EcuadorEgypt, Arab Rep.El SalvadorEquatorial GuineaEritreaEstoniaEthiopiaEuro areaEurope & Central AsiaEurope & Central Asia (excluding high income)Europe & Central Asia (IDA & IBRD countries)European UnionFaroe IslandsFijiFinlandFragile and conflict affected situationsFranceFrench PolynesiaGabonGambia, TheGeorgiaGermanyGhanaGreeceGreenlandGrenadaGuatemalaGuineaGuinea-BissauGuyanaHaitiHeavily indebted poor countries (HIPC)High incomeHondurasHong Kong SAR, ChinaHungaryIBRD onlyIcelandIDA & IBRD totalIDA blendIDA onlyIDA totalIndiaIndonesiaIran, Islamic Rep.IraqIrelandIsraelItalyJamaicaJapanJordanKazakhstanKenyaKiribatiKorea, Rep.KuwaitKyrgyz RepublicLao PDRLate-demographic dividendLatin America & Caribbean Latin America & Caribbean (excluding high income)Latin America & the Caribbean (IDA & IBRD countries)LatviaLeast developed countries: UN classificationLebanonLesothoLiberiaLibyaLithuaniaLow & middle incomeLow incomeLower middle incomeLuxembourgMacao SAR, ChinaMacedonia, FYRMadagascarMalawiMalaysiaMaldivesMaliMaltaMauritaniaMauritiusMexicoMiddle East & North AfricaMiddle East & North Africa (excluding high income)Middle East & North Africa (IDA & IBRD countries)Middle incomeMoldovaMongoliaMoroccoMozambiqueMyanmarNamibiaNepalNetherlandsNew CaledoniaNew ZealandNicaraguaNigerNigeriaNorth AmericaNorwayOECD membersOmanOther small statesPacific island small statesPakistanPalauPanamaPapua New GuineaParaguayPeruPhilippinesPolandPortugalPost-demographic dividendPre-demographic dividendQatarRomaniaRussian FederationRwandaSamoaSao Tome and PrincipeSaudi ArabiaSenegalSerbiaSeychellesSierra LeoneSingaporeSlovak RepublicSloveniaSmall statesSolomon IslandsSomaliaSouth AfricaSouth AsiaSouth Asia (IDA & IBRD)SpainSri LankaSt. Kitts and NevisSt. LuciaSt. Vincent and the GrenadinesSub-Saharan Africa Sub-Saharan Africa (excluding high income)Sub-Saharan Africa (IDA & IBRD countries)SudanSurinameSwazilandSwedenSwitzerlandSyrian Arab RepublicTajikistanTanzaniaThailandTimor-LesteTogoTongaTrinidad and TobagoTunisiaTurkeyTurkmenistanTurks and Caicos IslandsTuvaluUgandaUkraineUnited Arab EmiratesUnited KingdomUnited StatesUpper middle incomeUruguayVanuatuVenezuela, RBVietnamVirgin Islands (U.S.)WorldYemen, Rep.ZambiaZimbabwe La ligne de temps
Cette échelle de temps montre un graphique de 1963 année à 2016 année Canada. Les données jusqu'à 1962 année ne sont pas présentés. Quantité d'observations actuelles selon dates: 54.
Source (désignation):
Les indicateurs du développement mondiale
Source (organisation):
World Bank staff estimates from the Comtrade database maintained by the United Nations Statistics Division.
Catégories:
Energy & Mining, Private Sector, Trade
Dernière mise à jour
23 avr. 2017
Les indicateurs de changement de valeurs selon les années
Minimum:
2.147
1 janv. 2004
Maximum:
5.073
1 janv. 1967
Pour la date d''observation
Valeur
Changement absolu
Le changement par rapport à la valeur précédente
1 janv. 1963
4.539
+4.539
0.0%
1 janv. 1964
4.971
+0.432
9.52%
1 janv. 1965
5.06
+0.089
1.79%
1 janv. 1966
5.017
-0.043
-0.84%
1 janv. 1967
5.073
+0.056
1.11%
1 janv. 1968
4.075
-0.999
-19.68%
1 janv. 1969
4.274
+0.2
4.9%
1 janv. 1970
3.747
-0.527
-12.33%
1 janv. 1971
3.844
+0.097
2.59%
1 janv. 1972
3.625
-0.219
-5.71%
1 janv. 1973
3.228
-0.397
-10.94%
1 janv. 1974
3.428
+0.199
6.18%
1 janv. 1975
3.581
+0.153
4.47%
1 janv. 1976
3.13
-0.45
-12.58%
1 janv. 1977
2.807
-0.324
-10.34%
1 janv. 1978
2.591
-0.216
-7.68%
1 janv. 1979
2.647
+0.056
2.14%
1 janv. 1980
3.349
+0.702
26.53%
1 janv. 1981
4.803
+1.454
43.41%
1 janv. 1982
3.806
-0.997
-20.76%
1 janv. 1983
3.489
-0.316
-8.31%
1 janv. 1984
3.531
+0.041
1.19%
1 janv. 1985
3.211
-0.32
-9.07%
1 janv. 1986
2.811
-0.399
-12.43%
1 janv. 1987
2.822
+0.011
0.39%
1 janv. 1988
2.569
-0.254
-8.99%
1 janv. 1989
2.893
+0.324
12.61%
1 janv. 1990
3.07
+0.177
6.12%
1 janv. 1991
2.769
-0.3
-9.79%
1 janv. 1992
2.48
-0.289
-10.43%
1 janv. 1993
2.531
+0.051
2.05%
1 janv. 1994
2.377
-0.155
-6.1%
1 janv. 1995
2.602
+0.226
9.49%
1 janv. 1996
2.97
+0.368
14.13%
1 janv. 1997
2.677
-0.293
-9.86%
1 janv. 1998
2.56
-0.117
-4.37%
1 janv. 1999
2.356
-0.204
-7.97%
1 janv. 2000
2.21
-0.146
-6.2%
1 janv. 2001
2.314
+0.104
4.72%
1 janv. 2002
2.22
-0.094
-4.07%
1 janv. 2003
2.175
-0.045
-2.04%
1 janv. 2004
2.147
-0.028
-1.29%
1 janv. 2005
2.556
+0.409
19.04%
1 janv. 2006
2.514
-0.042
-1.63%
1 janv. 2007
2.909
+0.395
15.69%
1 janv. 2008
2.974
+0.065
2.22%
1 janv. 2009
2.872
-0.102
-3.42%
1 janv. 2010
2.297
-0.575
-20.03%
1 janv. 2011
2.808
+0.511
22.26%
1 janv. 2012
3.22
+0.412
14.68%
1 janv. 2013
2.725
-0.495
-15.38%
1 janv. 2014
2.531
-0.193
-7.09%
1 janv. 2015
2.676
+0.145
5.71%
1 janv. 2016
2.687
+0.011
0.41%
Classement des pays selon les statistiques actuelles par années


Commentaires: