29
/es/
es
AIzaSyAYiBZKx7MnpbEhh9jyipgxe19OcubqV5w
April 1, 2024
99931
Cameroon
CMR
true
2
1
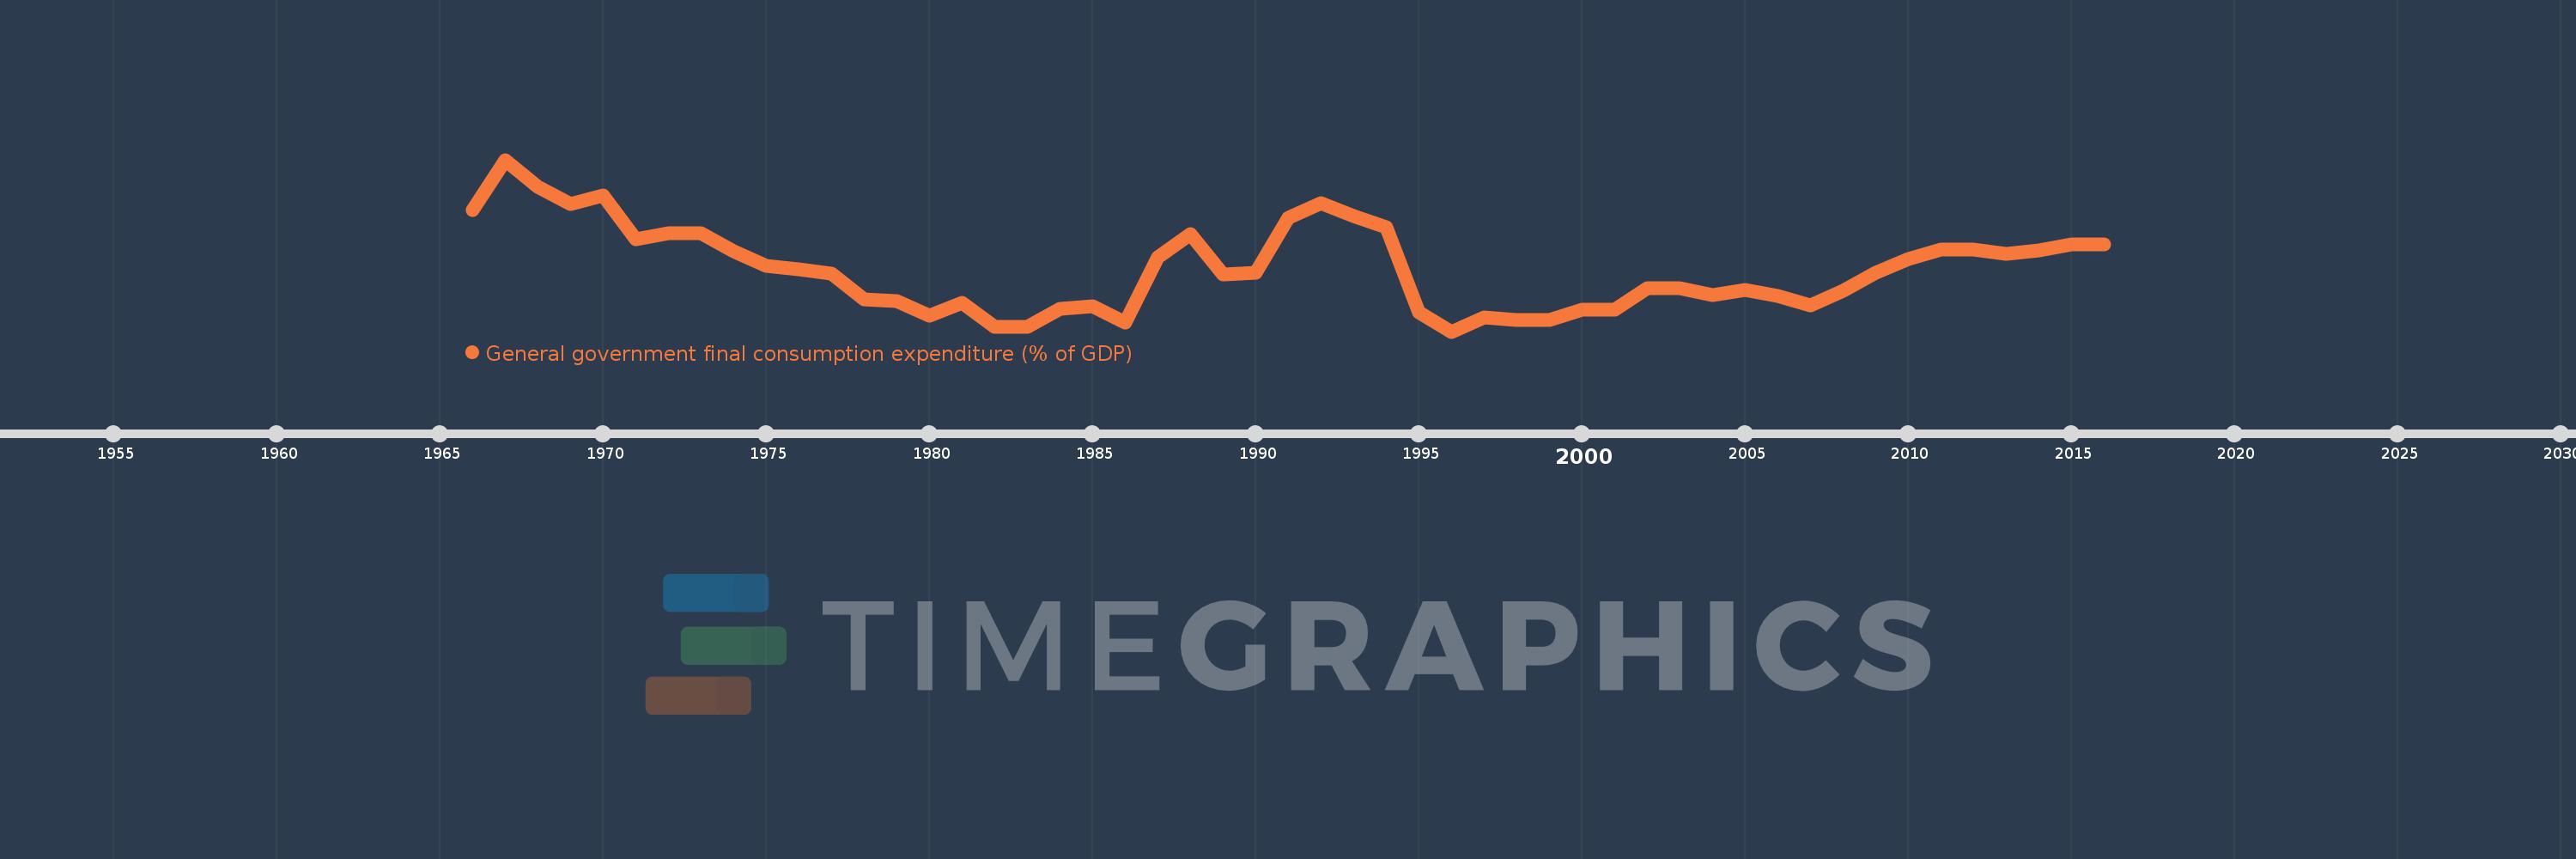
General government final consumption expenditure (% of GDP)
2016,2015,2014,2013,2012,2011,2010,2009,2008,2007,2006,2005,2004,2003,2002,2001,2000,1999,1998,1997,1996,1995,1994,1993,1992,1991,1990,1989,1988,1987,1986,1985,1984,1983,1982,1981,1980,1979,1978,1977,1976,1975,1974,1973,1972,1971,1970,1969,1968,1967,1966
Estas estadísticas en otros países:
AfghanistanAlbaniaAlgeriaAngolaAntigua and BarbudaArab WorldArgentinaArmeniaArubaAustraliaAustriaAzerbaijanBahamas, TheBahrainBangladeshBarbadosBelarusBelgiumBelizeBeninBermudaBhutanBoliviaBosnia and HerzegovinaBotswanaBrazilBrunei DarussalamBulgariaBurkina FasoBurundiCabo VerdeCambodiaCameroonCanadaCaribbean small statesCentral African RepublicCentral Europe and the BalticsChadChileChinaColombiaComorosCongo, Dem. Rep.Congo, Rep.Costa RicaCote d'IvoireCroatiaCubaCyprusCzech RepublicDenmarkDjiboutiDominicaDominican RepublicEarly-demographic dividendEast Asia & PacificEast Asia & Pacific (excluding high income)East Asia & Pacific (IDA & IBRD countries)EcuadorEgypt, Arab Rep.El SalvadorEquatorial GuineaEritreaEstoniaEthiopiaEuro areaEurope & Central AsiaEurope & Central Asia (excluding high income)Europe & Central Asia (IDA & IBRD countries)European UnionFaroe IslandsFijiFinlandFragile and conflict affected situationsFranceFrench PolynesiaGabonGambia, TheGeorgiaGermanyGhanaGreeceGrenadaGuatemalaGuineaGuinea-BissauGuyanaHaitiHeavily indebted poor countries (HIPC)High incomeHondurasHong Kong SAR, ChinaHungaryIBRD onlyIcelandIDA & IBRD totalIDA blendIDA onlyIDA totalIndiaIndonesiaIran, Islamic Rep.IraqIrelandIsraelItalyJamaicaJapanJordanKazakhstanKenyaKiribatiKorea, Rep.KosovoKuwaitKyrgyz RepublicLao PDRLate-demographic dividendLatin America & Caribbean Latin America & Caribbean (excluding high income)Latin America & the Caribbean (IDA & IBRD countries)LatviaLeast developed countries: UN classificationLebanonLesothoLiberiaLibyaLithuaniaLow & middle incomeLow incomeLower middle incomeLuxembourgMacao SAR, ChinaMacedonia, FYRMadagascarMalawiMalaysiaMaldivesMaliMaltaMauritaniaMauritiusMexicoMicronesia, Fed. Sts.Middle East & North AfricaMiddle East & North Africa (excluding high income)Middle East & North Africa (IDA & IBRD countries)Middle incomeMoldovaMongoliaMontenegroMoroccoMozambiqueNamibiaNepalNetherlandsNew CaledoniaNew ZealandNicaraguaNigerNigeriaNorth AmericaNorwayOECD membersOmanOther small statesPacific island small statesPakistanPanamaPapua New GuineaParaguayPeruPhilippinesPolandPortugalPost-demographic dividendPre-demographic dividendPuerto RicoQatarRomaniaRussian FederationRwandaSaudi ArabiaSenegalSerbiaSeychellesSierra LeoneSingaporeSlovak RepublicSloveniaSmall statesSolomon IslandsSomaliaSouth AfricaSouth AsiaSouth Asia (IDA & IBRD)South SudanSpainSri LankaSt. Kitts and NevisSt. LuciaSt. Vincent and the GrenadinesSub-Saharan Africa Sub-Saharan Africa (excluding high income)Sub-Saharan Africa (IDA & IBRD countries)SudanSurinameSwazilandSwedenSwitzerlandSyrian Arab RepublicTajikistanTanzaniaThailandTimor-LesteTogoTongaTrinidad and TobagoTunisiaTurkeyTurkmenistanUgandaUkraineUnited Arab EmiratesUnited KingdomUnited StatesUpper middle incomeUruguayUzbekistanVanuatuVenezuela, RBVietnamWest Bank and GazaWorldYemen, Rep.ZambiaZimbabwe línea de tiempo (timeline):
En esta escala de tiempo se presenta un gráfico de 1966 y 2016 de Cameroon. Los datos de 1965 están ausentes. El número de observaciones reales por fecha: 51.
Fuente (nombre):
Indicadores del desarrollo mundial
Fuente (organización):
World Bank national accounts data, and OECD National Accounts data files.
Categorías:
Economy & Growth
Se ha actualizado:
23 abr 2017 año
Los indicadores de los cambios de valor en los últimos años
Mínimo:
8.676
1 ene 1996 año
Máximo:
14.825
1 ene 1967 año
A la fecha de observación
Valor
Cambio absoluto
El cambio con respecto al valor anterior
1 ene 1966 año
13.033
+13.033
0.0%
1 ene 1967 año
14.825
+1.793
13.76%
1 ene 1968 año
13.851
-0.974
-6.57%
1 ene 1969 año
13.243
-0.608
-4.39%
1 ene 1970 año
13.562
+0.318
2.4%
1 ene 1971 año
11.974
-1.588
-11.71%
1 ene 1972 año
12.184
+0.211
1.76%
1 ene 1973 año
12.182
-0.002
-0.02%
1 ene 1974 año
11.562
-0.62
-5.09%
1 ene 1975 año
11.034
-0.528
-4.57%
1 ene 1976 año
10.893
-0.141
-1.28%
1 ene 1977 año
10.758
-0.135
-1.24%
1 ene 1978 año
9.82
-0.938
-8.72%
1 ene 1979 año
9.77
-0.05
-0.51%
1 ene 1980 año
9.237
-0.533
-5.46%
1 ene 1981 año
9.701
+0.464
5.02%
1 ene 1982 año
8.857
-0.844
-8.7%
1 ene 1983 año
8.838
-0.019
-0.21%
1 ene 1984 año
9.5
+0.662
7.49%
1 ene 1985 año
9.59
+0.09
0.95%
1 ene 1986 año
8.995
-0.595
-6.21%
1 ene 1987 año
11.337
+2.342
26.03%
1 ene 1988 año
12.155
+0.818
7.22%
1 ene 1989 año
10.728
-1.427
-11.74%
1 ene 1990 año
10.771
+0.043
0.4%
1 ene 1991 año
12.751
+1.979
18.38%
1 ene 1992 año
13.275
+0.524
4.11%
1 ene 1993 año
12.813
-0.462
-3.48%
1 ene 1994 año
12.404
-0.409
-3.19%
1 ene 1995 año
9.381
-3.023
-24.37%
1 ene 1996 año
8.676
-0.704
-7.51%
1 ene 1997 año
9.175
+0.499
5.75%
1 ene 1998 año
9.1
-0.075
-0.81%
1 ene 1999 año
9.093
-0.008
-0.08%
1 ene 2000 año
9.459
+0.366
4.03%
1 ene 2001 año
9.457
-0.002
-0.02%
1 ene 2002 año
10.236
+0.78
8.24%
1 ene 2003 año
10.222
-0.015
-0.14%
1 ene 2004 año
9.975
-0.247
-2.42%
1 ene 2005 año
10.164
+0.19
1.9%
1 ene 2006 año
9.967
-0.197
-1.94%
1 ene 2007 año
9.601
-0.366
-3.67%
1 ene 2008 año
10.146
+0.545
5.67%
1 ene 2009 año
10.795
+0.65
6.4%
1 ene 2010 año
11.262
+0.467
4.32%
1 ene 2011 año
11.611
+0.349
3.1%
1 ene 2012 año
11.615
+0.004
0.04%
1 ene 2013 año
11.456
-0.16
-1.38%
1 ene 2014 año
11.573
+0.118
1.03%
1 ene 2015 año
11.811
+0.237
2.05%
1 ene 2016 año
11.791
-0.02
-0.17%
Ranking de los países por los datos estadísticos actuales


Comentarios: