29
/es/
es
AIzaSyAYiBZKx7MnpbEhh9jyipgxe19OcubqV5w
April 1, 2024
94608
Burkina Faso
BFA
true
2
1
CO2 emissions (kt)
2014,2013,2012,2011,2010,2009,2008,2007,2006,2005,2004,2003,2002,2001,2000,1999,1998,1997,1996,1995,1994,1993,1992,1991,1990,1989,1988,1987,1986,1985,1984,1983,1982,1981,1980,1979,1978,1977,1976,1975,1974,1973,1972,1971,1970,1969,1968,1967,1966,1965,1964,1963,1962,1961
Estas estadísticas en otros países:
AfghanistanAlbaniaAlgeriaAndorraAngolaAntigua and BarbudaArab WorldArgentinaArmeniaArubaAustraliaAustriaAzerbaijanBahamas, TheBahrainBangladeshBarbadosBelarusBelgiumBelizeBeninBermudaBhutanBoliviaBosnia and HerzegovinaBotswanaBrazilBritish Virgin IslandsBrunei DarussalamBulgariaBurkina FasoBurundiCabo VerdeCambodiaCameroonCanadaCaribbean small statesCayman IslandsCentral African RepublicCentral Europe and the BalticsChadChileChinaColombiaComorosCongo, Dem. Rep.Congo, Rep.Costa RicaCote d'IvoireCroatiaCubaCuracaoCyprusCzech RepublicDenmarkDjiboutiDominicaDominican RepublicEarly-demographic dividendEast Asia & PacificEast Asia & Pacific (excluding high income)East Asia & Pacific (IDA & IBRD countries)EcuadorEgypt, Arab Rep.El SalvadorEquatorial GuineaEritreaEstoniaEthiopiaEuro areaEurope & Central AsiaEurope & Central Asia (excluding high income)Europe & Central Asia (IDA & IBRD countries)European UnionFaroe IslandsFijiFinlandFragile and conflict affected situationsFranceFrench PolynesiaGabonGambia, TheGeorgiaGermanyGhanaGibraltarGreeceGreenlandGrenadaGuatemalaGuineaGuinea-BissauGuyanaHaitiHeavily indebted poor countries (HIPC)High incomeHondurasHong Kong SAR, ChinaHungaryIBRD onlyIcelandIDA & IBRD totalIDA blendIDA onlyIDA totalIndiaIndonesiaIran, Islamic Rep.IraqIrelandIsraelItalyJamaicaJapanJordanKazakhstanKenyaKiribatiKorea, Dem. People’s Rep.Korea, Rep.KuwaitKyrgyz RepublicLao PDRLate-demographic dividendLatin America & Caribbean Latin America & Caribbean (excluding high income)Latin America & the Caribbean (IDA & IBRD countries)LatviaLeast developed countries: UN classificationLebanonLesothoLiberiaLibyaLiechtensteinLithuaniaLow & middle incomeLow incomeLower middle incomeLuxembourgMacao SAR, ChinaMacedonia, FYRMadagascarMalawiMalaysiaMaldivesMaliMaltaMarshall IslandsMauritaniaMauritiusMexicoMicronesia, Fed. Sts.Middle East & North AfricaMiddle East & North Africa (excluding high income)Middle East & North Africa (IDA & IBRD countries)Middle incomeMoldovaMongoliaMontenegroMoroccoMozambiqueMyanmarNamibiaNauruNepalNetherlandsNew CaledoniaNew ZealandNicaraguaNigerNigeriaNorth AmericaNorwayOECD membersOmanOther small statesPacific island small statesPakistanPalauPanamaPapua New GuineaParaguayPeruPhilippinesPolandPortugalPost-demographic dividendPre-demographic dividendQatarRomaniaRussian FederationRwandaSamoaSao Tome and PrincipeSaudi ArabiaSenegalSerbiaSeychellesSierra LeoneSingaporeSint Maarten (Dutch part)Slovak RepublicSloveniaSmall statesSolomon IslandsSomaliaSouth AfricaSouth AsiaSouth Asia (IDA & IBRD)South SudanSpainSri LankaSt. Kitts and NevisSt. LuciaSt. Vincent and the GrenadinesSub-Saharan Africa Sub-Saharan Africa (excluding high income)Sub-Saharan Africa (IDA & IBRD countries)SudanSurinameSwazilandSwedenSwitzerlandSyrian Arab RepublicTajikistanTanzaniaThailandTimor-LesteTogoTongaTrinidad and TobagoTunisiaTurkeyTurkmenistanTurks and Caicos IslandsUgandaUkraineUnited Arab EmiratesUnited KingdomUnited StatesUpper middle incomeUruguayUzbekistanVanuatuVenezuela, RBVietnamWest Bank and GazaWorldYemen, Rep.ZambiaZimbabwe línea de tiempo (timeline):
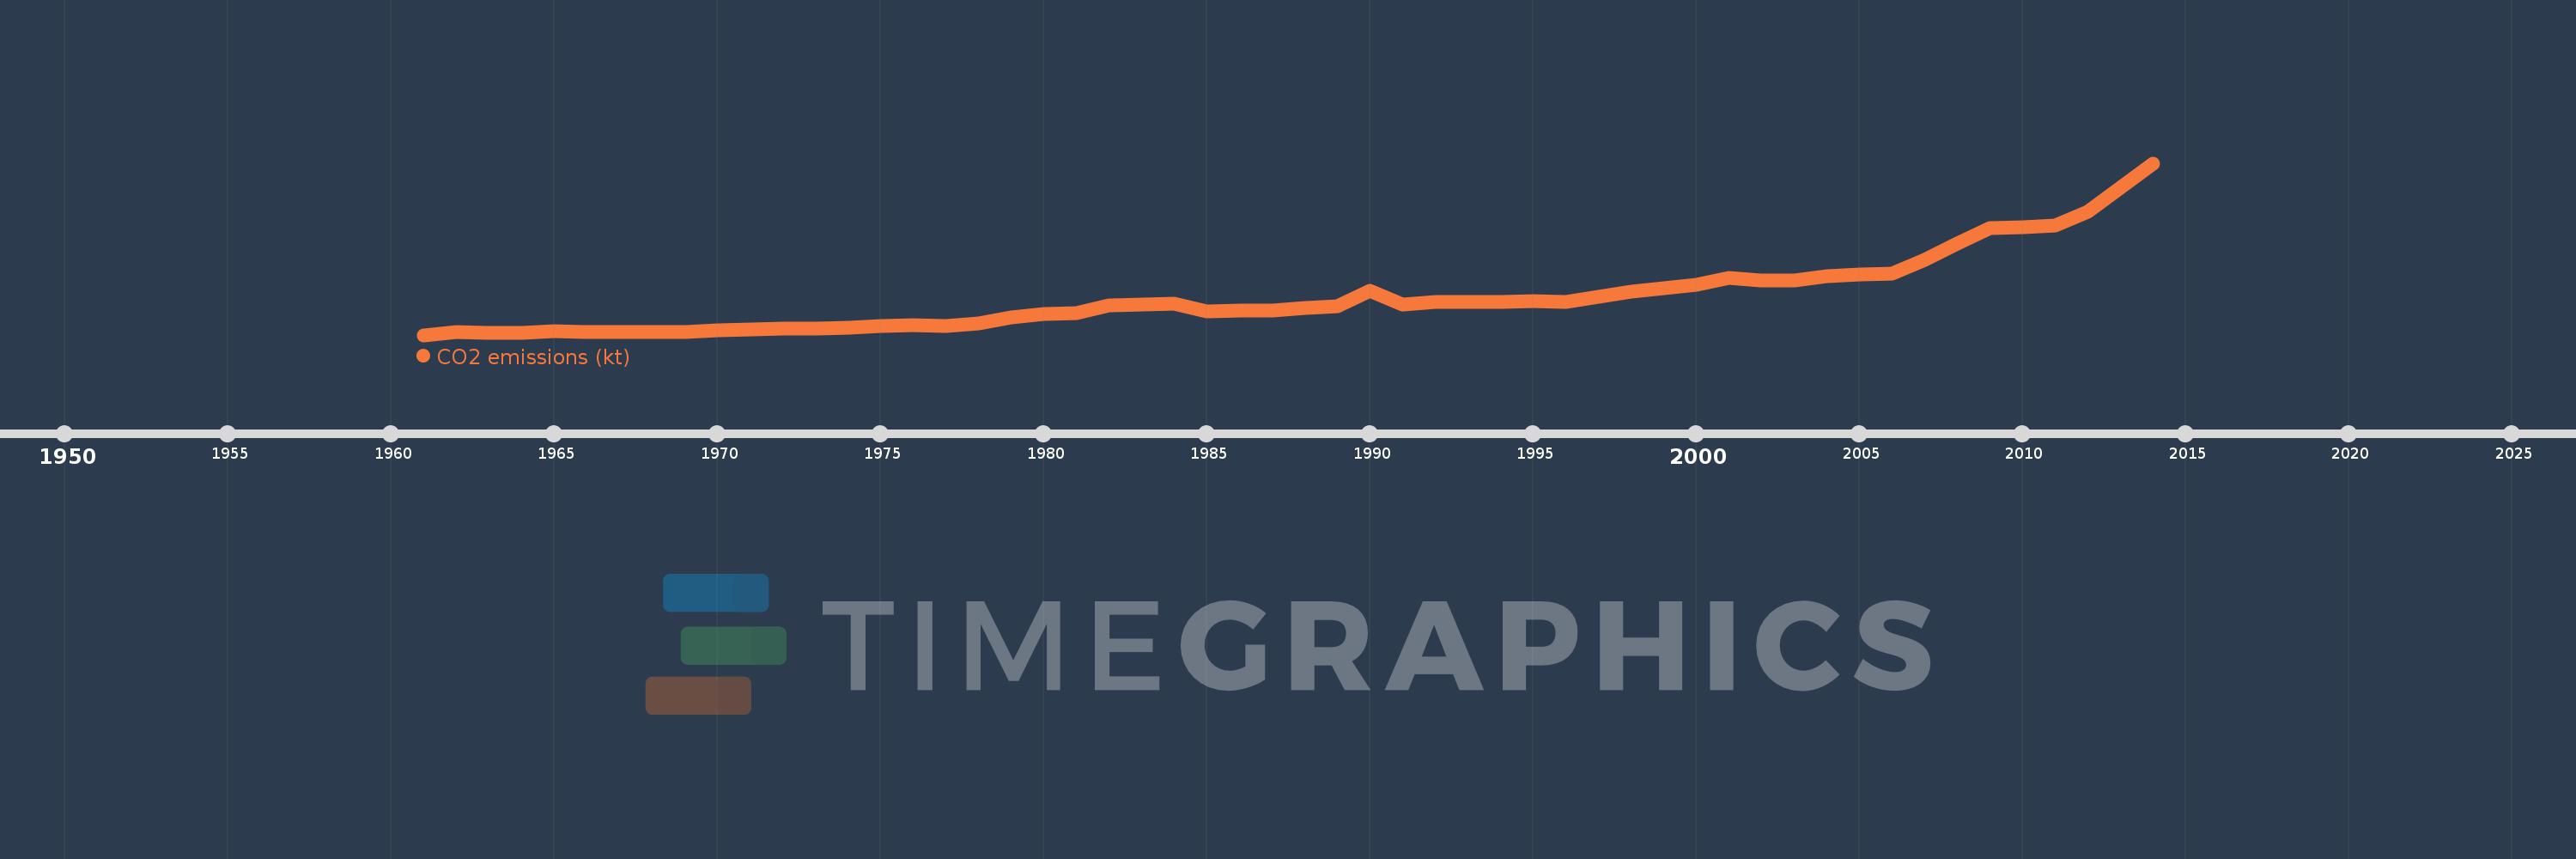
En esta escala de tiempo se presenta un gráfico de 1961 y 2014 de Burkina Faso. Los datos de 1960 están ausentes. El número de observaciones reales por fecha: 54.
Fuente (nombre):
Indicadores del desarrollo mundial
Fuente (organización):
Carbon Dioxide Information Analysis Center, Environmental Sciences Division, Oak Ridge National Laboratory, Tennessee, United States.
Categorías:
Climate Change, Environment
Se ha actualizado:
23 abr 2017 año
Los indicadores de los cambios de valor en los últimos años
Mínimo:
44.004
1 ene 1961 año
Máximo:
3.058 mil
1 ene 2014 año
A la fecha de observación
Valor
Cambio absoluto
El cambio con respecto al valor anterior
1 ene 1961 año
44.004
+44.004
0.0%
1 ene 1962 año
91.675
+47.671
108.33%
1 ene 1963 año
84.341
-7.334
-8.0%
1 ene 1964 año
88.008
+3.667
4.35%
1 ene 1965 año
110.01
+22.002
25.0%
1 ene 1966 año
102.676
-7.334
-6.67%
1 ene 1967 año
102.676
0.0
0.0%
1 ene 1968 año
102.676
0.0
0.0%
1 ene 1969 año
102.676
0.0
0.0%
1 ene 1970 año
121.011
+18.335
17.86%
1 ene 1971 año
143.013
+22.002
18.18%
1 ene 1972 año
150.347
+7.334
5.13%
1 ene 1973 año
161.348
+11.001
7.32%
1 ene 1974 año
168.682
+7.334
4.55%
1 ene 1975 año
205.352
+36.67
21.74%
1 ene 1976 año
220.02
+14.668
7.14%
1 ene 1977 año
209.019
-11.001
-5.0%
1 ene 1978 año
249.356
+40.337
19.3%
1 ene 1979 año
348.365
+99.009
39.71%
1 ene 1980 año
407.037
+58.672
16.84%
1 ene 1981 año
432.706
+25.669
6.31%
1 ene 1982 año
557.384
+124.678
28.81%
1 ene 1983 año
575.719
+18.335
3.29%
1 ene 1984 año
594.054
+18.335
3.18%
1 ene 1985 año
465.709
-128.345
-21.6%
1 ene 1986 año
476.71
+11.001
2.36%
1 ene 1987 año
480.377
+3.667
0.77%
1 ene 1988 año
517.047
+36.67
7.63%
1 ene 1989 año
553.717
+36.67
7.09%
1 ene 1990 año
821.408
+267.691
48.34%
1 ene 1991 año
583.053
-238.355
-29.02%
1 ene 1992 año
627.057
+44.004
7.55%
1 ene 1993 año
630.724
+3.667
0.58%
1 ene 1994 año
627.057
-3.667
-0.58%
1 ene 1995 año
645.392
+18.335
2.92%
1 ene 1996 año
627.057
-18.335
-2.84%
1 ene 1997 año
707.731
+80.674
12.87%
1 ene 1998 año
806.74
+99.009
13.99%
1 ene 1999 año
861.745
+55.005
6.82%
1 ene 2000 año
931.418
+69.673
8.09%
1 ene 2001 año
1.041 mil
+110.01
11.81%
1 ene 2002 año
997.424
-44.004
-4.23%
1 ene 2003 año
1.005 mil
+7.334
0.74%
1 ene 2004 año
1.078 mil
+73.34
7.3%
1 ene 2005 año
1.104 mil
+25.669
2.38%
1 ene 2006 año
1.126 mil
+22.002
1.99%
1 ene 2007 año
1.36 mil
+234.688
20.85%
1 ene 2008 año
1.646 mil
+286.026
21.02%
1 ene 2009 año
1.918 mil
+271.358
16.48%
1 ene 2010 año
1.933 mil
+14.668
0.76%
1 ene 2011 año
1.962 mil
+29.336
1.52%
1 ene 2012 año
2.211 mil
+249.356
12.71%
1 ene 2013 año
2.629 mil
+418.038
18.91%
1 ene 2014 año
3.058 mil
+429.039
16.32%
Ranking de los países por los datos estadísticos actuales


Comentarios: