29
/es/
es
AIzaSyAYiBZKx7MnpbEhh9jyipgxe19OcubqV5w
April 1, 2024
90328
Botswana
BWA
true
2
1
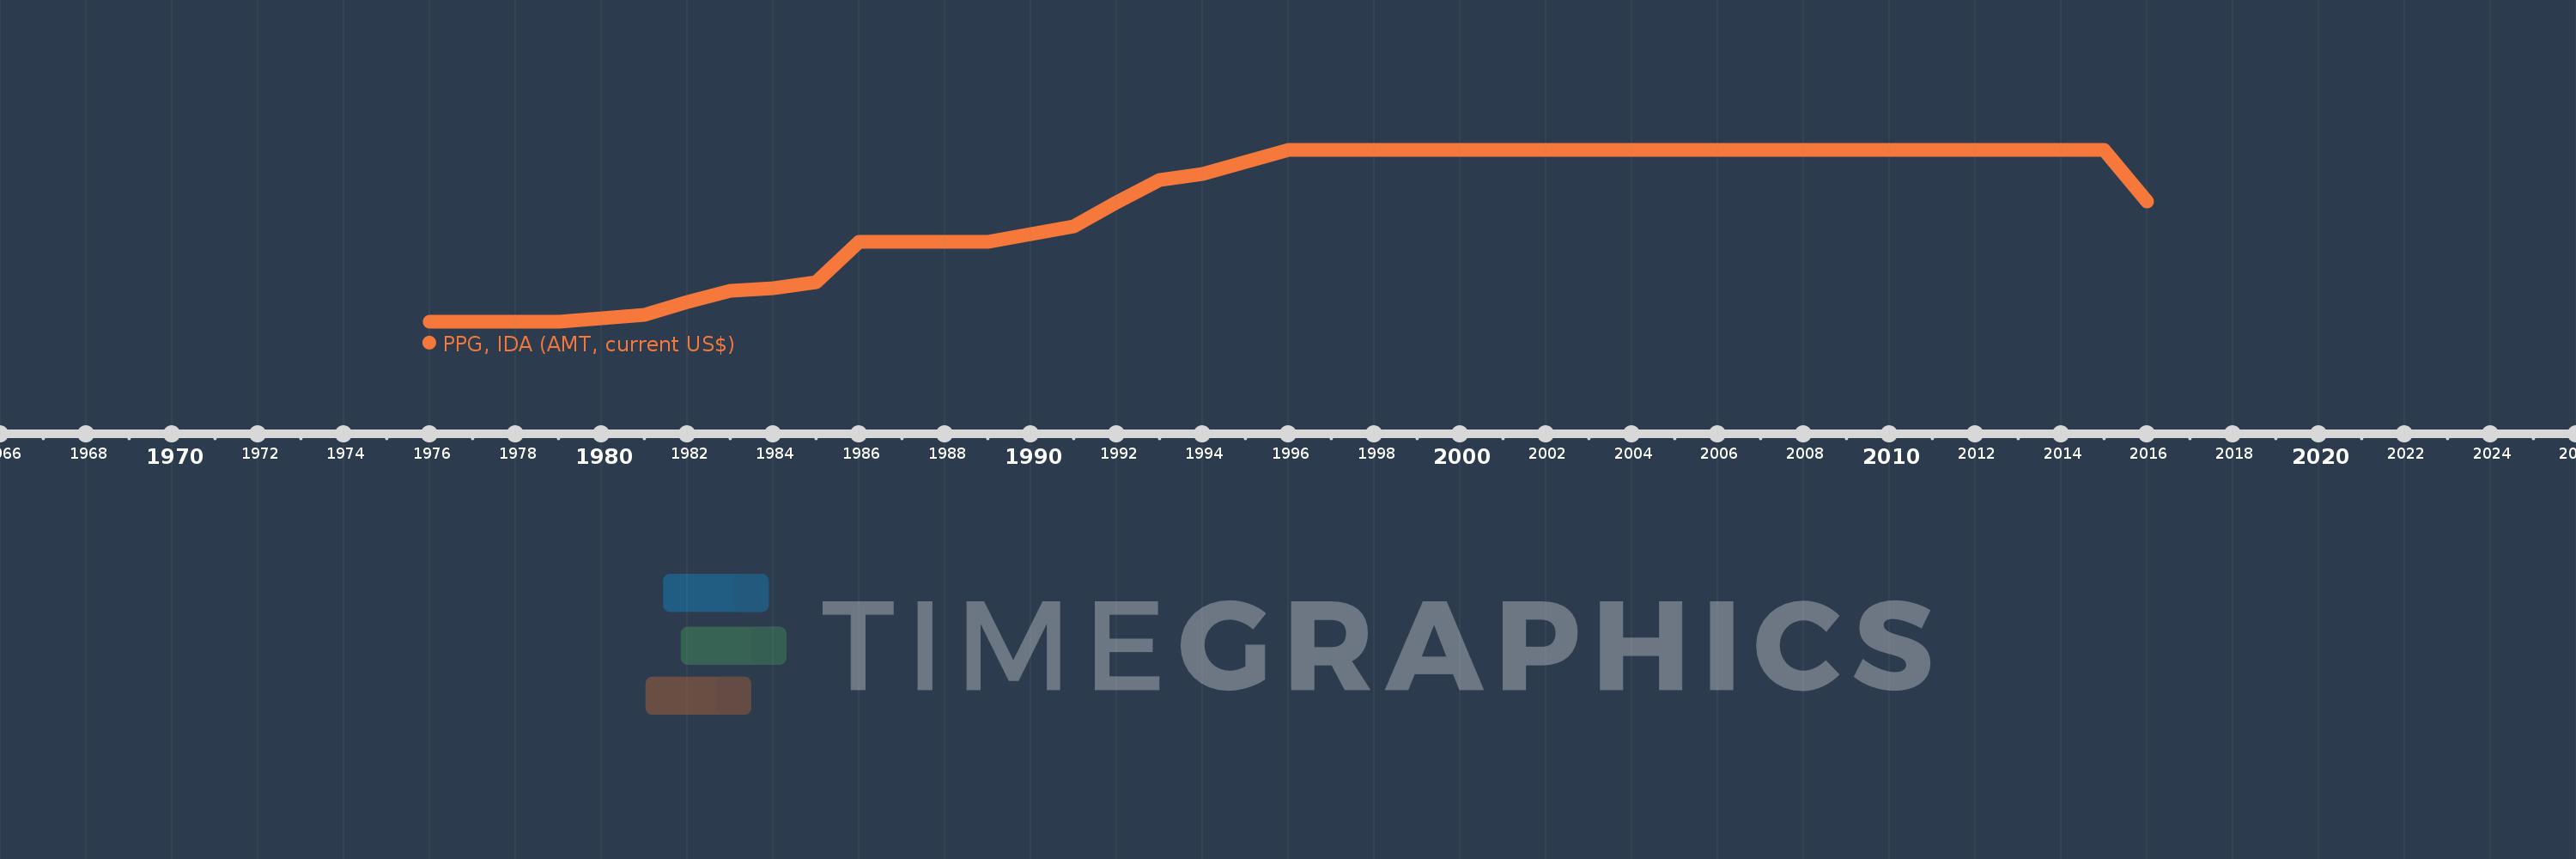
PPG, IDA (AMT, current US$)
2016,2015,2014,2013,2012,2011,2010,2009,2008,2007,2006,2005,2004,2003,2002,2001,2000,1999,1998,1997,1996,1995,1994,1993,1992,1991,1990,1989,1988,1987,1986,1985,1984,1983,1982,1981,1980,1979,1978,1977,1976
Estas estadísticas en otros países:
línea de tiempo (timeline):
En esta escala de tiempo se presenta un gráfico de 1976 y 2016 de Botswana. Los datos de 1975 están ausentes. El número de observaciones reales por fecha: 41.
Fuente (nombre):
Indicadores del desarrollo mundial
Fuente (organización):
World Bank, International Debt Statistics.
Categorías:
External Debt
Se ha actualizado:
23 abr 2017 año
Los indicadores de los cambios de valor en los últimos años
Mínimo:
43.0 mil
1 ene 1976 año
Máximo:
477.0 mil
1 ene 1996 año
A la fecha de observación
Valor
Cambio absoluto
El cambio con respecto al valor anterior
1 ene 1976 año
43.0 mil
+43.0 mil
0.0%
1 ene 1977 año
44.0 mil
+1000.0
2.33%
1 ene 1978 año
43.0 mil
-1000.0
-2.27%
1 ene 1979 año
44.0 mil
+1000.0
2.33%
1 ene 1980 año
52.0 mil
+8.0 mil
18.18%
1 ene 1981 año
62.0 mil
+10.0 mil
19.23%
1 ene 1982 año
93.0 mil
+31.0 mil
50.0%
1 ene 1983 año
121.0 mil
+28.0 mil
30.11%
1 ene 1984 año
129.0 mil
+8.0 mil
6.61%
1 ene 1985 año
143.0 mil
+14.0 mil
10.85%
1 ene 1986 año
245.0 mil
+102.0 mil
71.33%
1 ene 1987 año
246.0 mil
+1000.0
0.41%
1 ene 1988 año
246.0 mil
0.0
0.0%
1 ene 1989 año
245.0 mil
-1000.0
-0.41%
1 ene 1990 año
265.0 mil
+20.0 mil
8.16%
1 ene 1991 año
284.0 mil
+19.0 mil
7.17%
1 ene 1992 año
345.0 mil
+61.0 mil
21.48%
1 ene 1993 año
401.0 mil
+56.0 mil
16.23%
1 ene 1994 año
417.0 mil
+16.0 mil
3.99%
1 ene 1995 año
447.0 mil
+30.0 mil
7.19%
1 ene 1996 año
477.0 mil
+30.0 mil
6.71%
1 ene 1997 año
477.0 mil
0.0
0.0%
1 ene 1998 año
477.0 mil
0.0
0.0%
1 ene 1999 año
477.0 mil
0.0
0.0%
1 ene 2000 año
477.0 mil
0.0
0.0%
1 ene 2001 año
477.0 mil
0.0
0.0%
1 ene 2002 año
477.0 mil
0.0
0.0%
1 ene 2003 año
477.0 mil
0.0
0.0%
1 ene 2004 año
477.0 mil
0.0
0.0%
1 ene 2005 año
477.0 mil
0.0
0.0%
1 ene 2006 año
477.0 mil
0.0
0.0%
1 ene 2007 año
477.0 mil
0.0
0.0%
1 ene 2008 año
477.0 mil
0.0
0.0%
1 ene 2009 año
477.0 mil
0.0
0.0%
1 ene 2010 año
477.0 mil
0.0
0.0%
1 ene 2011 año
477.0 mil
0.0
0.0%
1 ene 2012 año
477.0 mil
0.0
0.0%
1 ene 2013 año
477.0 mil
0.0
0.0%
1 ene 2014 año
477.0 mil
0.0
0.0%
1 ene 2015 año
477.0 mil
0.0
0.0%
1 ene 2016 año
347.0 mil
-130.0 mil
-27.25%
Ranking de los países por los datos estadísticos actuales


Comentarios: