29
/es/
es
AIzaSyAYiBZKx7MnpbEhh9jyipgxe19OcubqV5w
April 1, 2024
86640
Bhutan
BTN
true
2
1
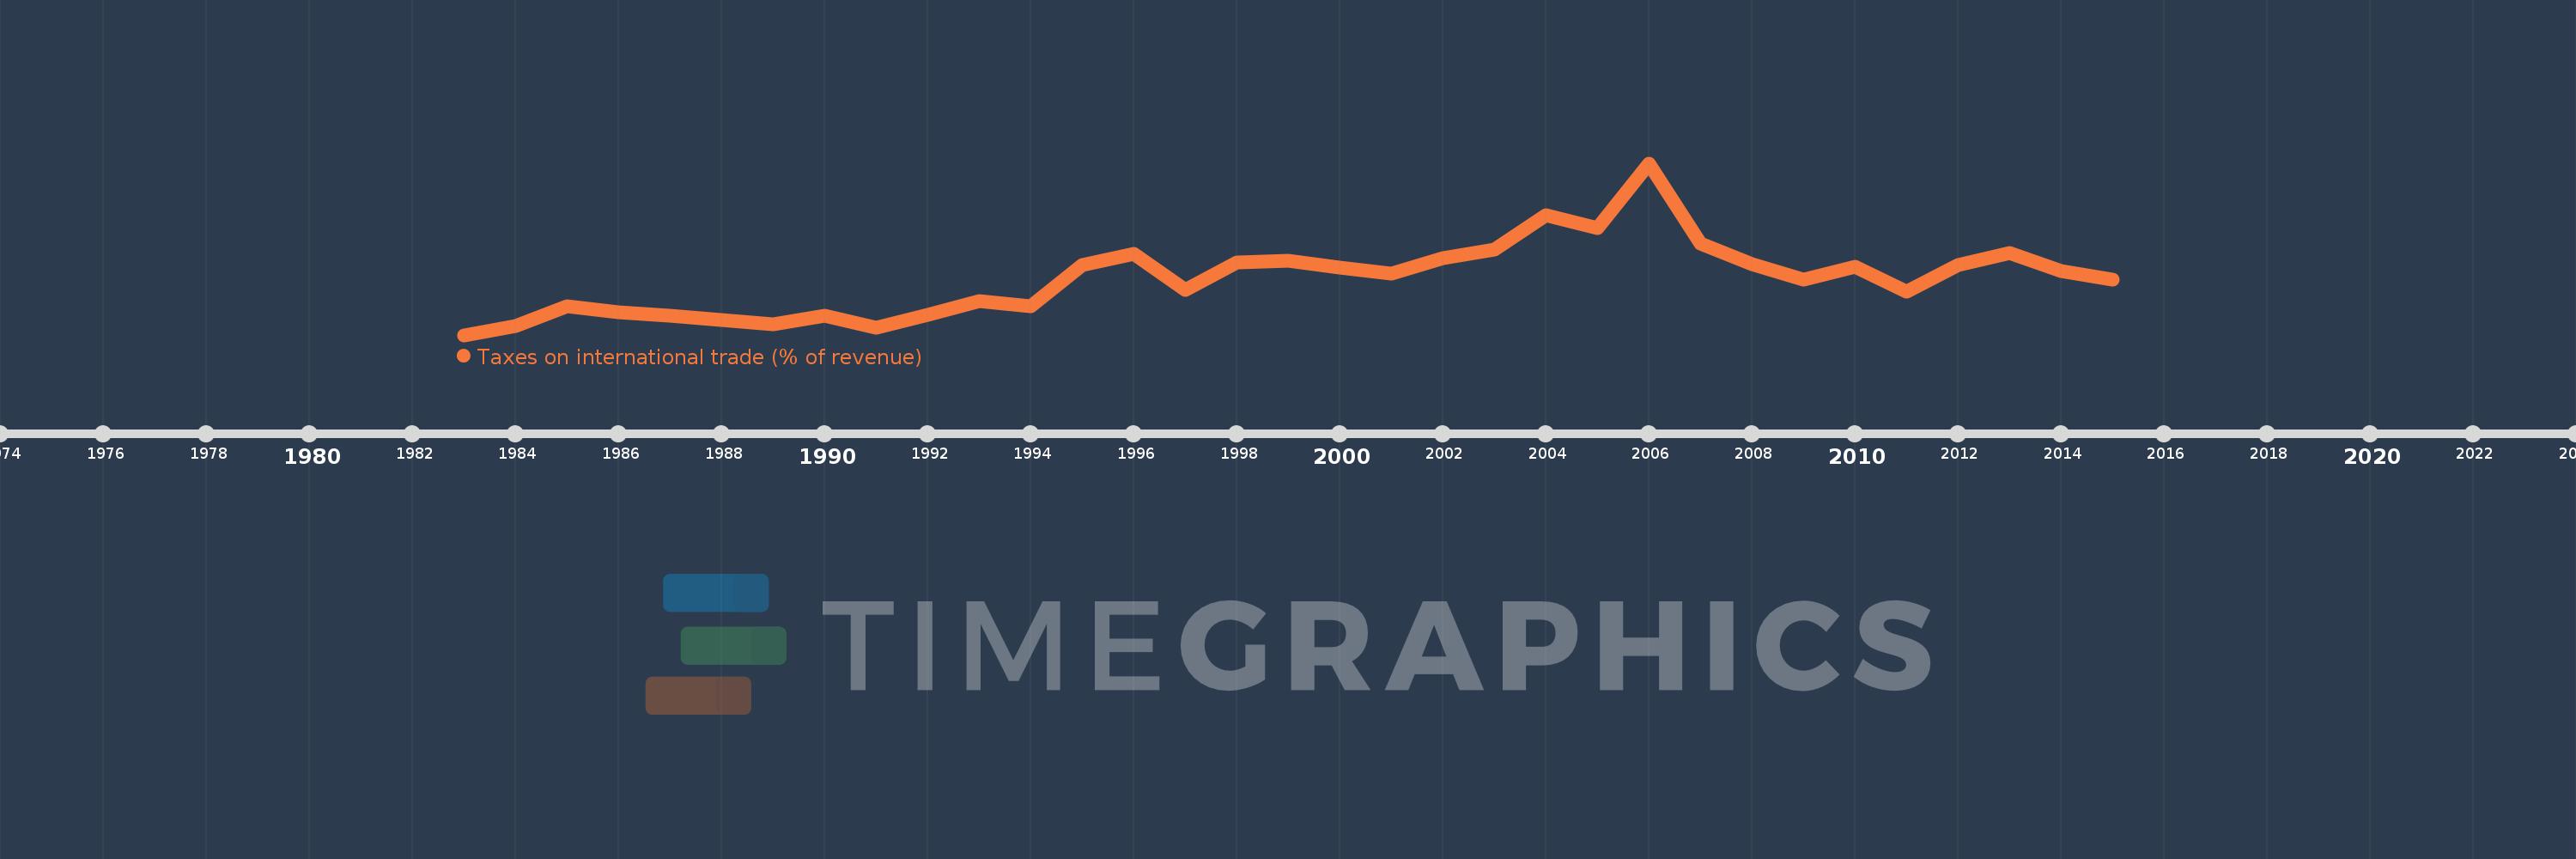
Taxes on international trade (% of revenue)
2015,2014,2013,2012,2011,2010,2009,2008,2007,2006,2005,2004,2003,2002,2001,2000,1999,1998,1997,1996,1995,1994,1993,1992,1991,1990,1989,1987,1986,1985,1984,1983
Estas estadísticas en otros países:
AfghanistanAlbaniaAlgeriaAngolaAntigua and BarbudaArab WorldArgentinaArmeniaAustraliaAustriaAzerbaijanBahamas, TheBahrainBangladeshBarbadosBelarusBelizeBeninBhutanBoliviaBosnia and HerzegovinaBotswanaBrazilBulgariaBurkina FasoBurundiCabo VerdeCambodiaCanadaCaribbean small statesCentral African RepublicCentral Europe and the BalticsChileChinaColombiaCongo, Dem. Rep.Congo, Rep.Costa RicaCote d'IvoireCroatiaCyprusCzech RepublicDenmarkDominicaDominican RepublicEarly-demographic dividendEast Asia & PacificEast Asia & Pacific (excluding high income)East Asia & Pacific (IDA & IBRD countries)Egypt, Arab Rep.El SalvadorEquatorial GuineaEstoniaEthiopiaEuro areaEurope & Central AsiaEurope & Central Asia (excluding high income)Europe & Central Asia (IDA & IBRD countries)European UnionFijiFinlandFranceGambia, TheGeorgiaGermanyGhanaGreeceGrenadaGuatemalaHeavily indebted poor countries (HIPC)High incomeHondurasHong Kong SAR, ChinaHungaryIBRD onlyIcelandIDA & IBRD totalIDA blendIDA onlyIDA totalIndiaIndonesiaIran, Islamic Rep.IraqIrelandIsraelItalyJamaicaJapanJordanKazakhstanKenyaKiribatiKorea, Rep.KuwaitKyrgyz RepublicLao PDRLate-demographic dividendLatin America & Caribbean Latin America & Caribbean (excluding high income)Latin America & the Caribbean (IDA & IBRD countries)LatviaLeast developed countries: UN classificationLebanonLesothoLiberiaLithuaniaLow & middle incomeLow incomeLower middle incomeLuxembourgMacedonia, FYRMadagascarMalawiMalaysiaMaldivesMaliMaltaMauritiusMexicoMicronesia, Fed. Sts.Middle East & North AfricaMiddle East & North Africa (excluding high income)Middle East & North Africa (IDA & IBRD countries)Middle incomeMoldovaMongoliaMoroccoMozambiqueMyanmarNamibiaNepalNetherlandsNew ZealandNicaraguaNorth AmericaNorwayOECD membersOmanOther small statesPakistanPanamaPapua New GuineaParaguayPeruPhilippinesPolandPortugalPost-demographic dividendPre-demographic dividendQatarRomaniaRussian FederationRwandaSamoaSan MarinoSao Tome and PrincipeSenegalSerbiaSeychellesSierra LeoneSingaporeSlovak RepublicSloveniaSmall statesSolomon IslandsSouth AfricaSouth AsiaSouth Asia (IDA & IBRD)SpainSri LankaSt. Kitts and NevisSt. LuciaSub-Saharan Africa Sub-Saharan Africa (excluding high income)Sub-Saharan Africa (IDA & IBRD countries)SurinameSwazilandSwedenSwitzerlandSyrian Arab RepublicTajikistanTanzaniaThailandTimor-LesteTogoTrinidad and TobagoTunisiaTurkeyUgandaUkraineUnited Arab EmiratesUnited KingdomUnited StatesUpper middle incomeUruguayVanuatuVenezuela, RBVietnamWest Bank and GazaWorldYemen, Rep.ZambiaZimbabwe línea de tiempo (timeline):
En esta escala de tiempo se presenta un gráfico de 1983 y 2015 de Bhutan. Los datos de 1982 están ausentes. El número de observaciones reales por fecha: 32.
Fuente (nombre):
Indicadores del desarrollo mundial
Fuente (organización):
International Monetary Fund, Government Finance Statistics Yearbook and data files.
Categorías:
Public Sector
Se ha actualizado:
23 abr 2017 año
Los indicadores de los cambios de valor en los últimos años
Mínimo:
0.121
1 ene 1983 año
Máximo:
2.311
1 ene 2006 año
A la fecha de observación
Valor
Cambio absoluto
El cambio con respecto al valor anterior
1 ene 1983 año
0.121
+0.121
0.0%
1 ene 1984 año
0.238
+0.117
97.02%
1 ene 1985 año
0.483
+0.246
103.38%
1 ene 1986 año
0.414
-0.069
-14.32%
1 ene 1987 año
0.367
-0.047
-11.24%
1 ene 1989 año
0.255
-0.112
-30.47%
1 ene 1990 año
0.367
+0.111
43.52%
1 ene 1991 año
0.219
-0.148
-40.28%
1 ene 1992 año
0.376
+0.157
71.69%
1 ene 1993 año
0.554
+0.178
47.41%
1 ene 1994 año
0.489
-0.065
-11.81%
1 ene 1995 año
1.017
+0.528
108.1%
1 ene 1996 año
1.159
+0.142
13.93%
1 ene 1997 año
0.692
-0.467
-40.31%
1 ene 1998 año
1.05
+0.359
51.85%
1 ene 1999 año
1.065
+0.015
1.43%
1 ene 2000 año
0.986
-0.079
-7.4%
1 ene 2001 año
0.905
-0.081
-8.23%
1 ene 2002 año
1.099
+0.193
21.37%
1 ene 2003 año
1.215
+0.116
10.58%
1 ene 2004 año
1.652
+0.438
36.01%
1 ene 2005 año
1.483
-0.169
-10.25%
1 ene 2006 año
2.311
+0.828
55.83%
1 ene 2007 año
1.289
-1.022
-44.24%
1 ene 2008 año
1.019
-0.269
-20.9%
1 ene 2009 año
0.832
-0.187
-18.34%
1 ene 2010 año
0.988
+0.156
18.75%
1 ene 2011 año
0.673
-0.315
-31.87%
1 ene 2012 año
1.016
+0.343
50.93%
1 ene 2013 año
1.166
+0.149
14.71%
1 ene 2014 año
0.937
-0.229
-19.67%
1 ene 2015 año
0.824
-0.112
-12.0%
Ranking de los países por los datos estadísticos actuales


Comentarios: